By Florence Sessoms
In 2021, I received funding from the Ontario Turfgrass Research Foundation to evaluate the effect of freezing temperatures on tall fescue after cold de-acclimation. This project was started because false-spring events, which are cold snaps following a series of warm days, seem to occur more often as a side effect of climate change. Our objective is to evaluate the tolerance of turf-type tall fescue cultivars to these false spring events and our experiments are carried out in controlled conditions (growth chamber and freezer) or in field conditions.
One experiment was started in fall 2021 and a second experiment was started in fall 2022. This year, on February 6, 2023, we removed the snow cover on certain plots (7 and 3 days of cold-deacclimation) to start our treatments for the second experiment. Tents were mounted on the plots and two heaters were placed inside to increase the temperatures inside the tents. Altogether, there were 3 treatments: plots received either 0 (no tent), 3, or 7 days of cold-deacclimation.
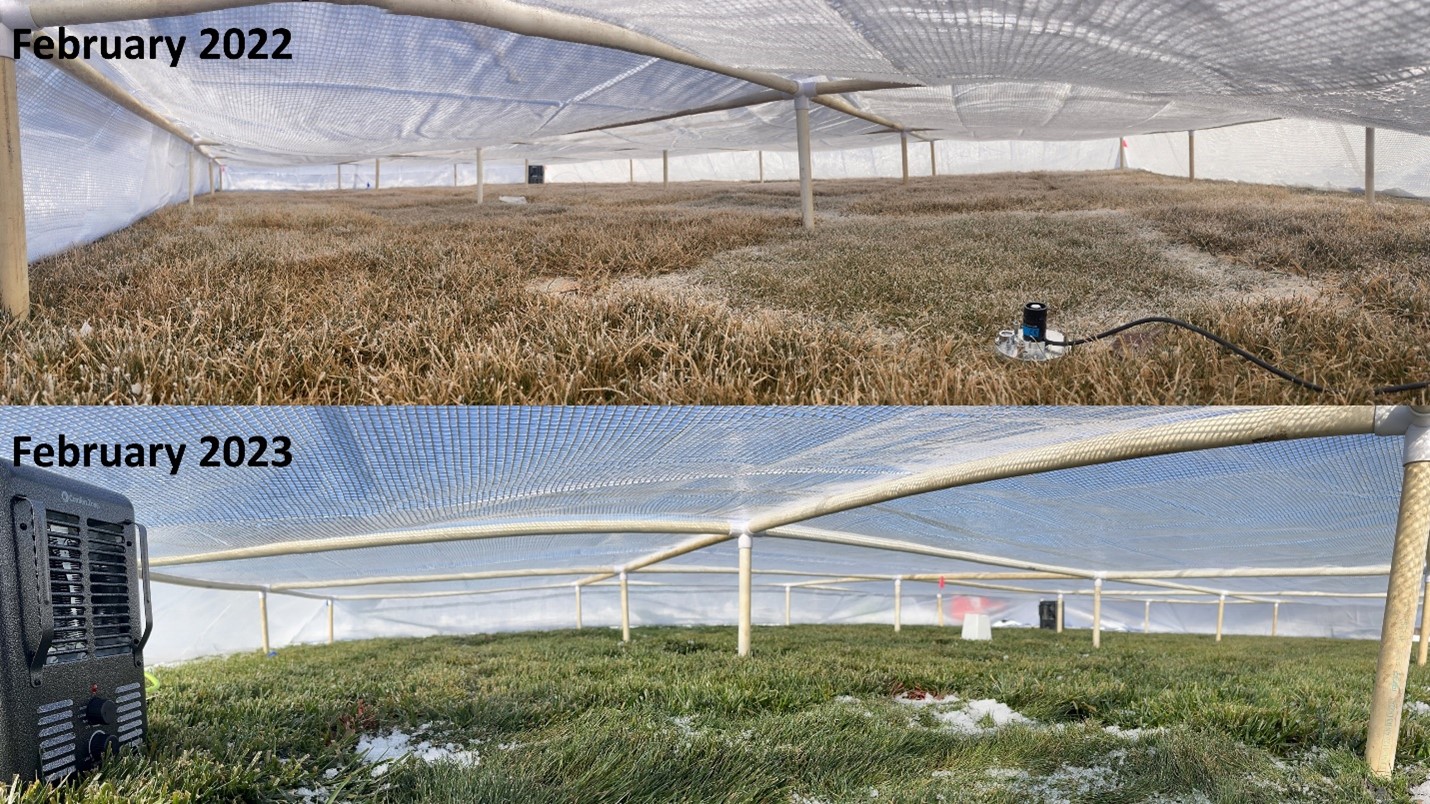
This year, when we removed the tents, I was surprised to observe that all plots were extremely green. I found a picture that was taken under the tent in February 2022 during the first run and observed that all plots were brownish yellow. It was interesting to observe that the two experimental runs presented quite different turfgrass color as seen in Figure 1.
This observation was puzzling as I wondered the cause for the two widely different turf colors. So, I started to look at the fall temperatures and date of first snow cover (above 1” for a minimum of 5 days). For fall 2021, there were 45 days when the average air temperatures were below 50 °F. The fall temperatures in 2022 were quite different with only 30 days of air temperatures below 50°F (and even warmer temperatures occurred during that period) and the beginning of snow cover (Figure 2). Overall, it seems that in fall 2022, the October-November months were warmer than in fall 2021. Toward the end of November 2022, we observed a drop in temperatures, but the field experiment was covered with 2 to 3 inches of snow. Additionally, the snow cover was earlier in 2022 (November 15) than for 2021 (December 5).
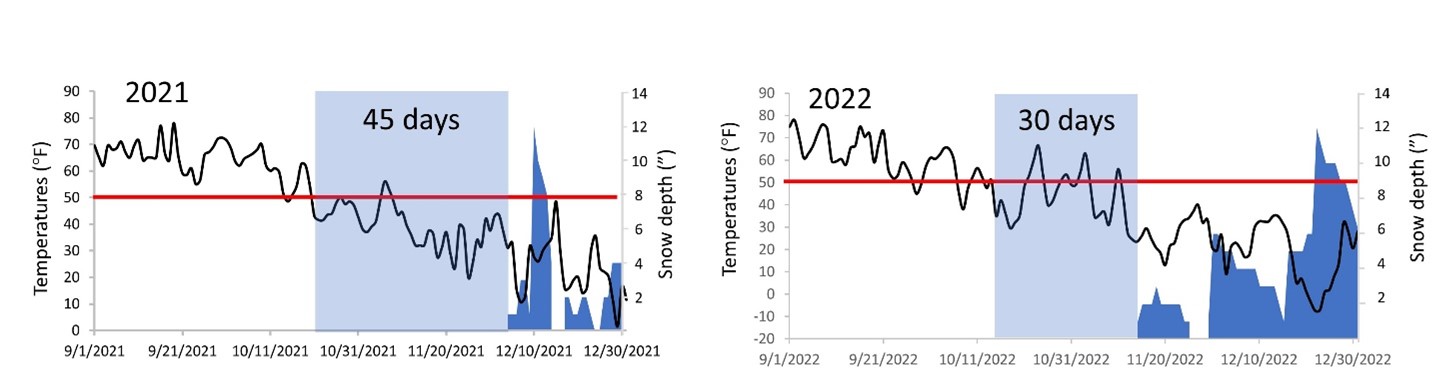
These two different fall climatic conditions resulted in different cold acclimation processes for the 2021-2022 and 2022-2023 field experiments and may explain why the plots differ in appearance from one year to the next.
Snow is a great insulator and can protect the vegetation from certain winter injuries. Figure 3 shows that the 2021-2022 plots were insulated with a snow cover that maintained a consistent temperature while areas where the snow was removed displayed variation of 15°F between day and night.

I find these observations quite interesting because certain winter injuries can be alleviated by the presence of a snow cover, in particular crown desiccation and freeze. However, long periods of snow cover can result in higher occurrence of snow mold.
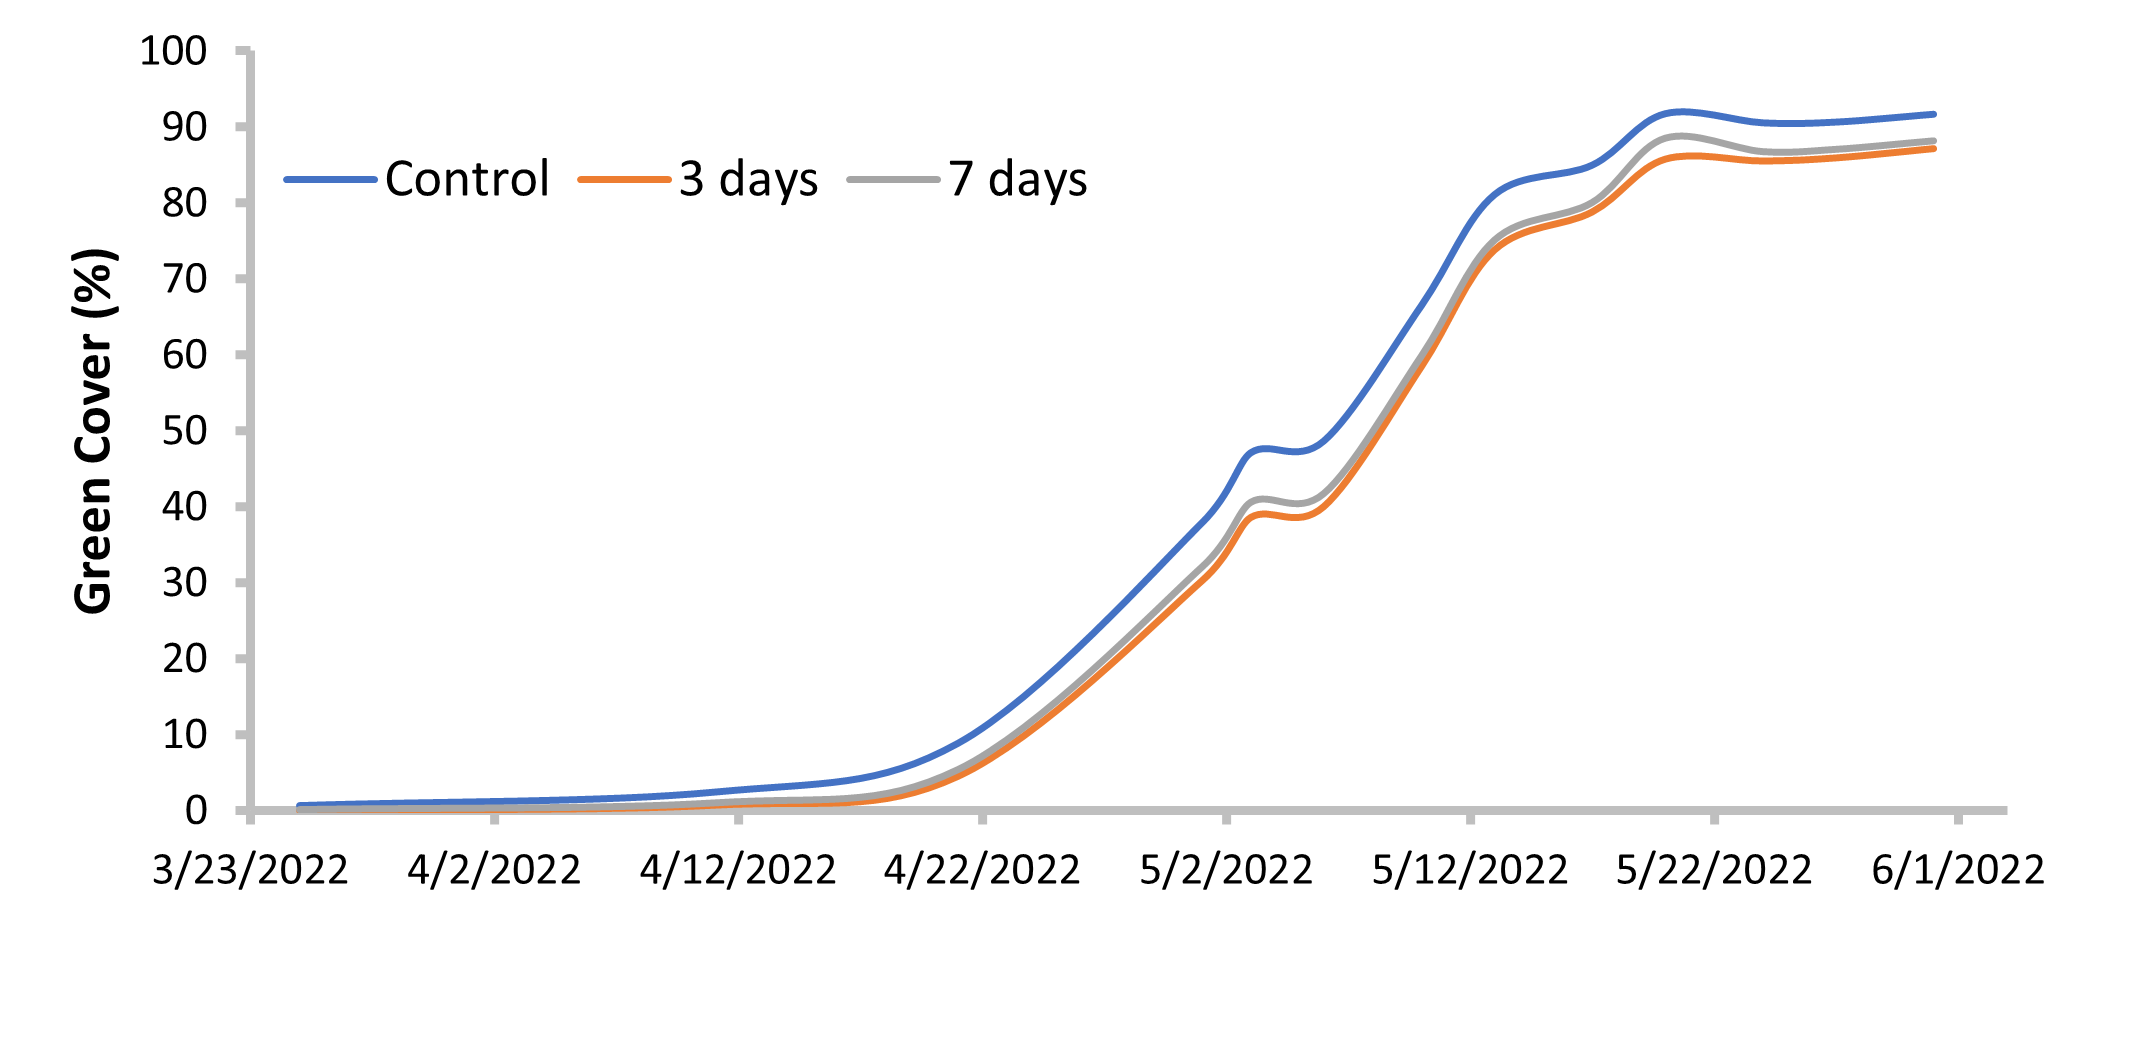
When I look at the late fall climatic conditions, I could make the assumptions that the 2021-2022 experimental set-up would be impacted by crown desiccation and/or freezing temperatures due to the absence of snow cover in November 2021. While no plots died during the 2021-2022 winter, we observed a very long spring green-up for all treatments. Snow was totally melted at the end of March 2022, and it took 56 days for the control plots to reach 90% of green cover. Interestingly the 3 and 7 days of cold de-acclimation showed slightly delayed spring green up compared to the control (Figure 4).
For spring 2023, my hypothesis is that spring green-up will be faster for the controls plots and I will observe a stronger impact of cold-deacclimation process on the treated plots; this is because we have observed very different 2021-2022 and 2022-2023 fall and winter conditions between the two experimental set-ups as described above. During this upcoming spring, I will be able to dig out the soil sensors and compare the soil temperatures between the two runs.
While this study is focused on tall fescue, the experimental approach used in this study could also be used to learn more about how other cool-season turfgrasses might respond to warming falls and winters in northern climates.