By Florence Sessoms
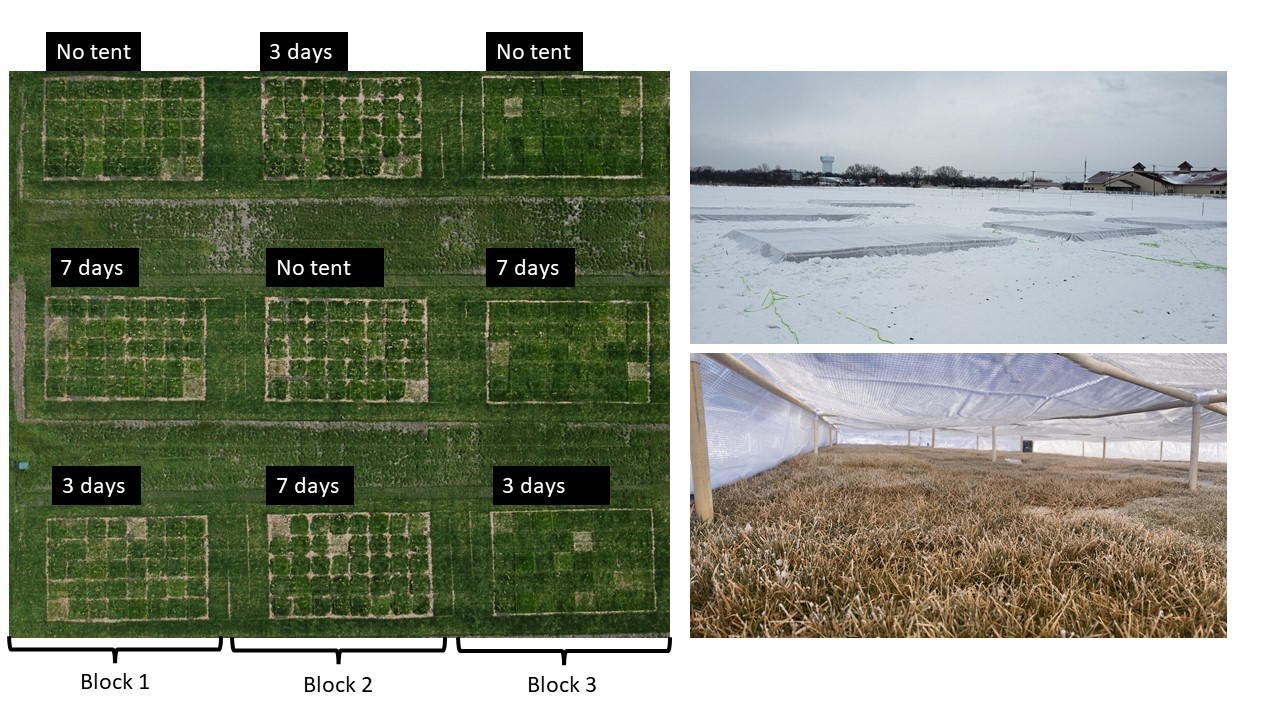
In Part 1 of this series, we discussed how false spring events affect turfgrass species. For the field experiment of this same project, we selected 32 cultivars of tall fescue, 6 cultivars of fine fescue species, 1 cultivar of Kentucky bluegrass, and 1 cultivar of perennial ryegrass. Cultivar selection was based on cultivar seed availability. Plots were seeded on September 8, 2021 so that the plots were established prior to the onset of winter. The experimental area consisted of 9 blocks, and within each block each cultivar was seeded in three replications; this allowed us to assign 3 blocks to each of the 3 treatments we wanted to compare: (1) no false spring (2) false spring of 3 days (3) false spring of 7 days. To create a false spring treatments, we artificially increased the temperature by tenting the plot area and using portable heaters to increase the temperature under the tent; we also maintained light availability by removing snow from the plots. This would then be followed by removing the tents and allowing the plot area to experience normal winter conditions--our hope was that the false spring would be followed by extremely low temperatures. Scheduling our “false spring” could not take place too early in the winter because (1) we needed to have a longer day length, and (2) the heater's ability to maintain a homogeneous temperature under the tent would be challenged if the air temperature was too low. We looked at the recent past temperature fluctuations (2019-2021) and mid-February seemed to be the appropriate time frame to start the experiment. The dehardening tents were placed on the selected plots (Figure 1) on Valentine’s Day for the 7 days treatment and 4 days later for the 3 days treatment. Snow cover was manually removed before the tents were built; two electric heaters were placed in the opposite direction to increase the air temperature.
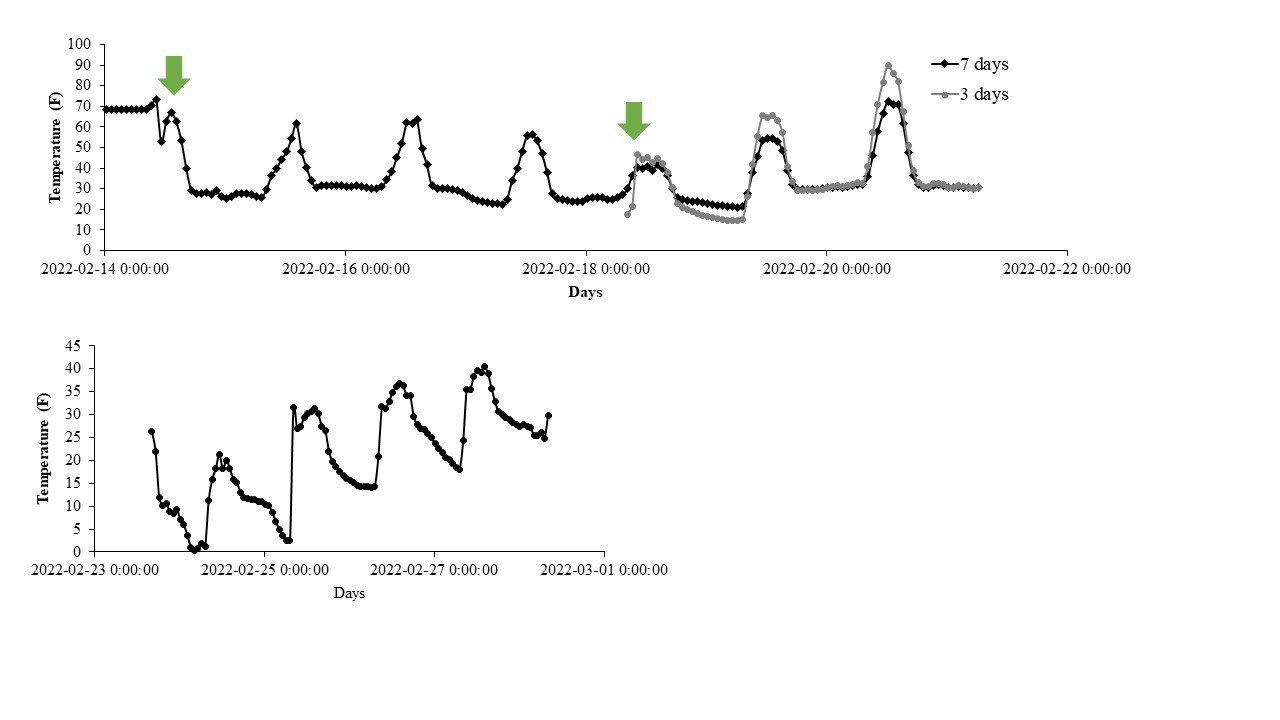
The light intensity was measured on a sunny day and recorded 900 μmol m–2s–1 in full sun and 400 μmol m–2s–1 under the tent. The quality of the light will be assessed later in the spring, since our spectroradiometer has difficulties making light measurements in the cold. We placed temperature sensors in the middle of each treatment. Figure 2 shows the variation of temperatures for the 7 days and 3 days treatment under the tent and during the following freezing period.
During the early spring, we will take spring green up data, turf quality and digital images for the evaluation of the percentage of green cover. We will carefully monitor the weather conditions to take the appropriate data before a potential freezing event in late March and April.
I would like to thank the seed companies that generously provided the tall fescue cultivars.


