By Dominic Petrella
This article was originally published on the Low Input Turf Using Fine Fescues blog.
Foliage (trees, shrubs, etc.) and structures (buildings, fences, etc.) can shade turfgrasses either by directly being over turf areas, or by casting shadows over the turf – both leading to poor turfgrass performance. As researchers, we try to classify how light changes under these areas to better understand how turfgrasses might respond, and to be able to breed better turfgrasses for shade. We collect data on spectral quality under trees, structures, and their shadows, then we can expose various germplasm to simulated shade to find the best plants. However, in order to do this to the best of our ability, we need to collect data under different scenarios. Below, I will discuss the different attributes of these different types of shade and how we may use this data to breed better turfgrasses. For a review of visible light spectra, how to interpret this data, and how spectral quality influences turfgrass growth and development, please refer to “Making sense of light data: Light quality”.
Direct foliar shade
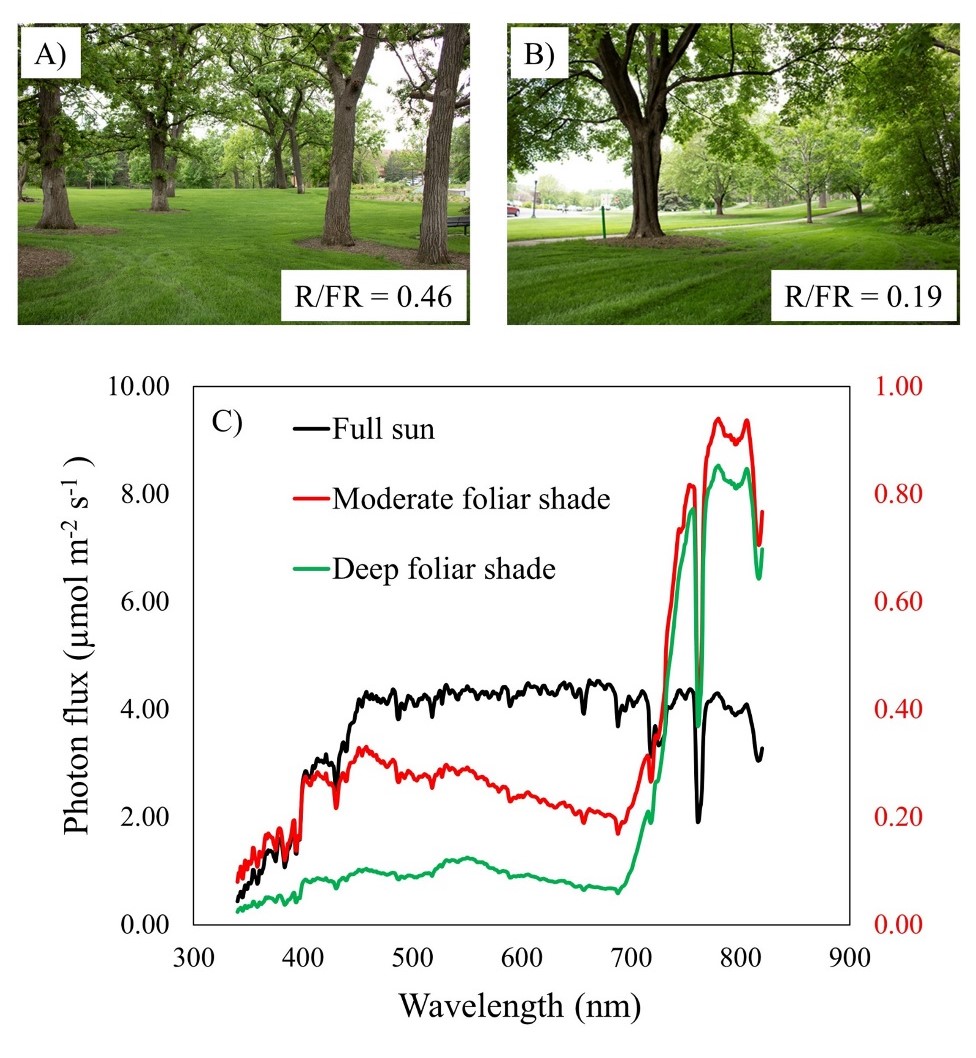
Attributes of foliar shade directly within the drip line of a tree(s) result in 1) reductions in the amount of light (reductions in photosynthetically active radiation – PAR), and 2) changes in the wavelengths of light (changes in spectral distribution), the turfgrass area will receive. Specific changes in spectral distribution directly under trees include greater reductions in the quantity of red light relative to the reduction in the quantity of far-red light (a reduction in the red to far-red ratio; R/FR ratio). Under full sun conditions, the R/FR ratio is approximately 1.20, and the R/FR ratio can be expected to decrease with increasing tree/shrub shade density (Figure 1). Disproportionally greater amounts of green light (500-600 nm light) can be found directly within areas of deep shade (Figure 1). In areas where the shade under a tree(s) is moderate, there are usually greater amounts of blue light (400-500 nm) compared to the other wavelengths (Figure 1).
Direct structural shade
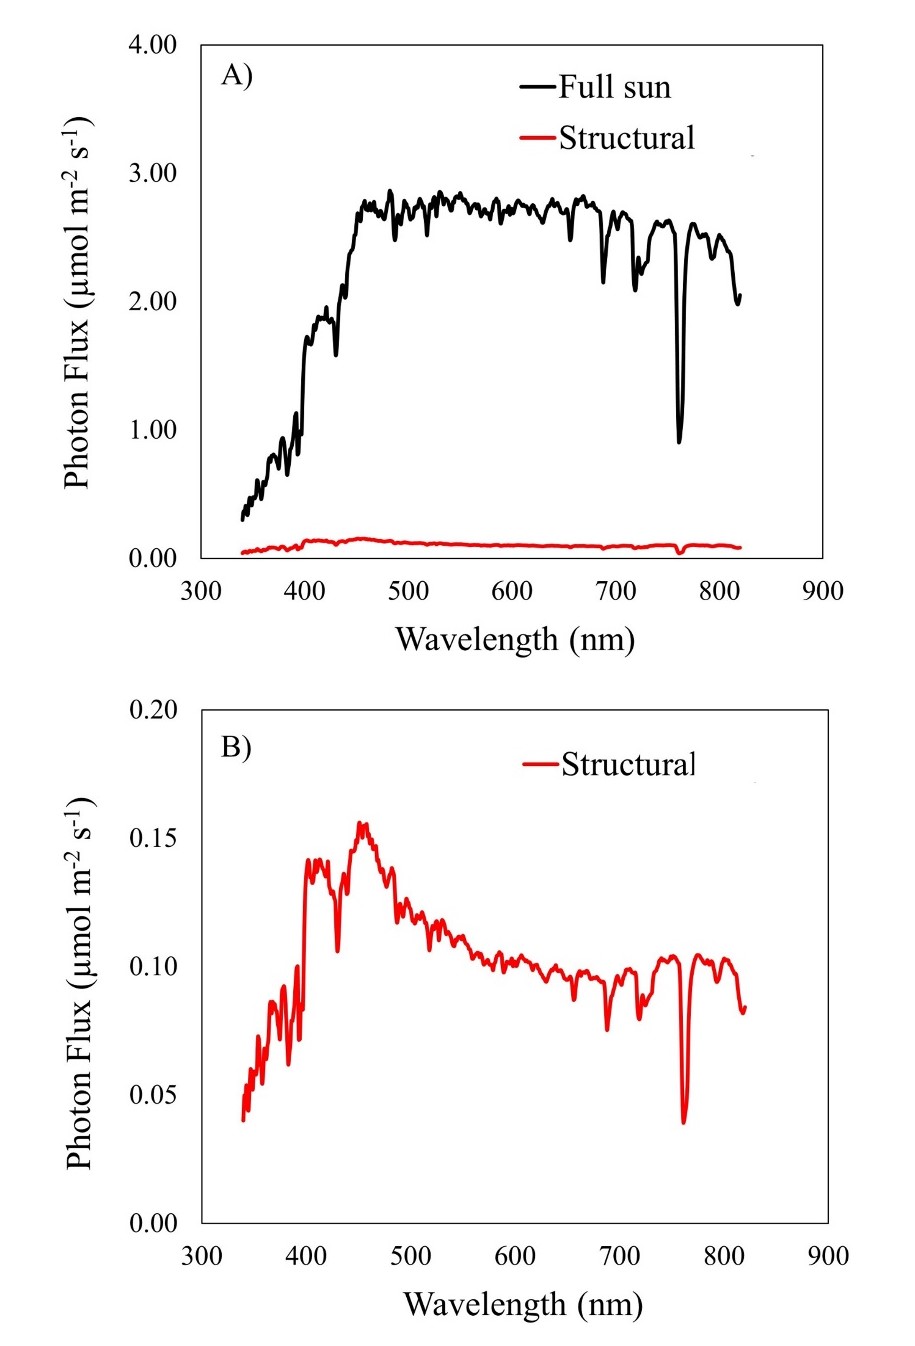
Turfgrasses that are directly growing under structures may be rarer, but can include areas growing under building overhangs, skywalks, or bridges. Traditional school of thought has indicated that primary changes to light under structures only includes reductions in light intensity, but when we take a closer look we can see a more complex situation (Figure 2). Large reductions in light intensity can prevent us from seeing how spectral distribution changes under structures (Figure 2A). When we look more closely at the spectral distribution under a structure, we can see there is a greater proportion of blue light compared to other wavelengths (Figure 2B). This relative increase in the proportion of blue light can be attributed to a loss in direct light and an increase in diffuse light in these areas (Holmes and Smith, 1977a). Diffuse light is enriched in blue wavelengths due to the greater degree of blue light scattering by components in the atmosphere (Young, 1981). This same idea can also be linked to the greater amount of blue light under areas of moderate foliar shade, in which more light diffuses to the ground relative to deep foliar shade. Turfgrass researchers (including myself) have generally thought about and designed experiments for structural shade as if the changes to the wavelengths of light were neutral (meaning all wavelengths of light are reduced by a similar level). However, we can see that even under structures, changes to spectral distribution do occur (Figure 2).
Foliar shadows
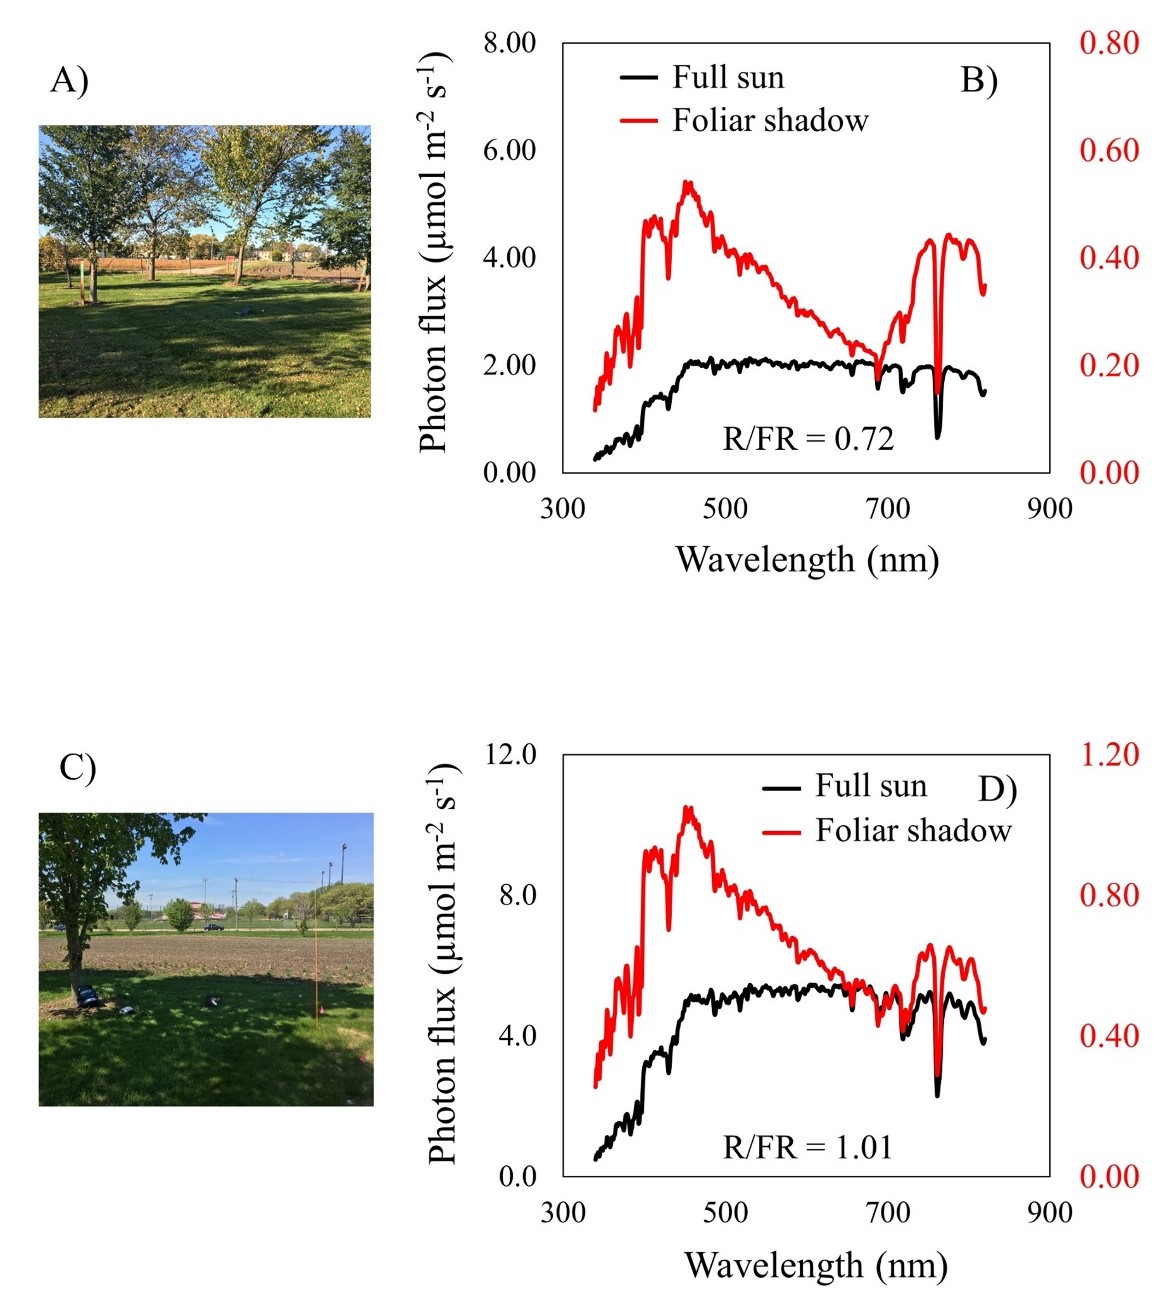
Besides being grown directly under a source of shade, a large amount of turfgrass areas can be found growing under shadows of both foliage and structures. Previously, we would think of all shadows as only reducing light intensity without changing spectral distribution, but we’re trying to improve how we classify how light changes under shadows of trees and structures. Looking at how light changes under two different foliar shadow scenarios, we can still see large changes in the quantity of specific wavelengths of light (Figure 3). In the shadow of a single tree within a larger grove of trees (Figure 3A), we can see a reduction in the R/FR ratio, and we can see a relatively greater amount of blue light (Figure 3B). On the other hand, in the shadow of single tree with little other trees around it (Figure 3C), we only see a steep increase in the relative amount of blue light, and the R/FR ratio is quite similar to full sun (Figure 3D). With these two scenarios, we can see that the spectral distribution within the shadow will change depending on what other vegetation is in the vicinity, but overall, we now can see that more than light intensity changes.
Structural shadows
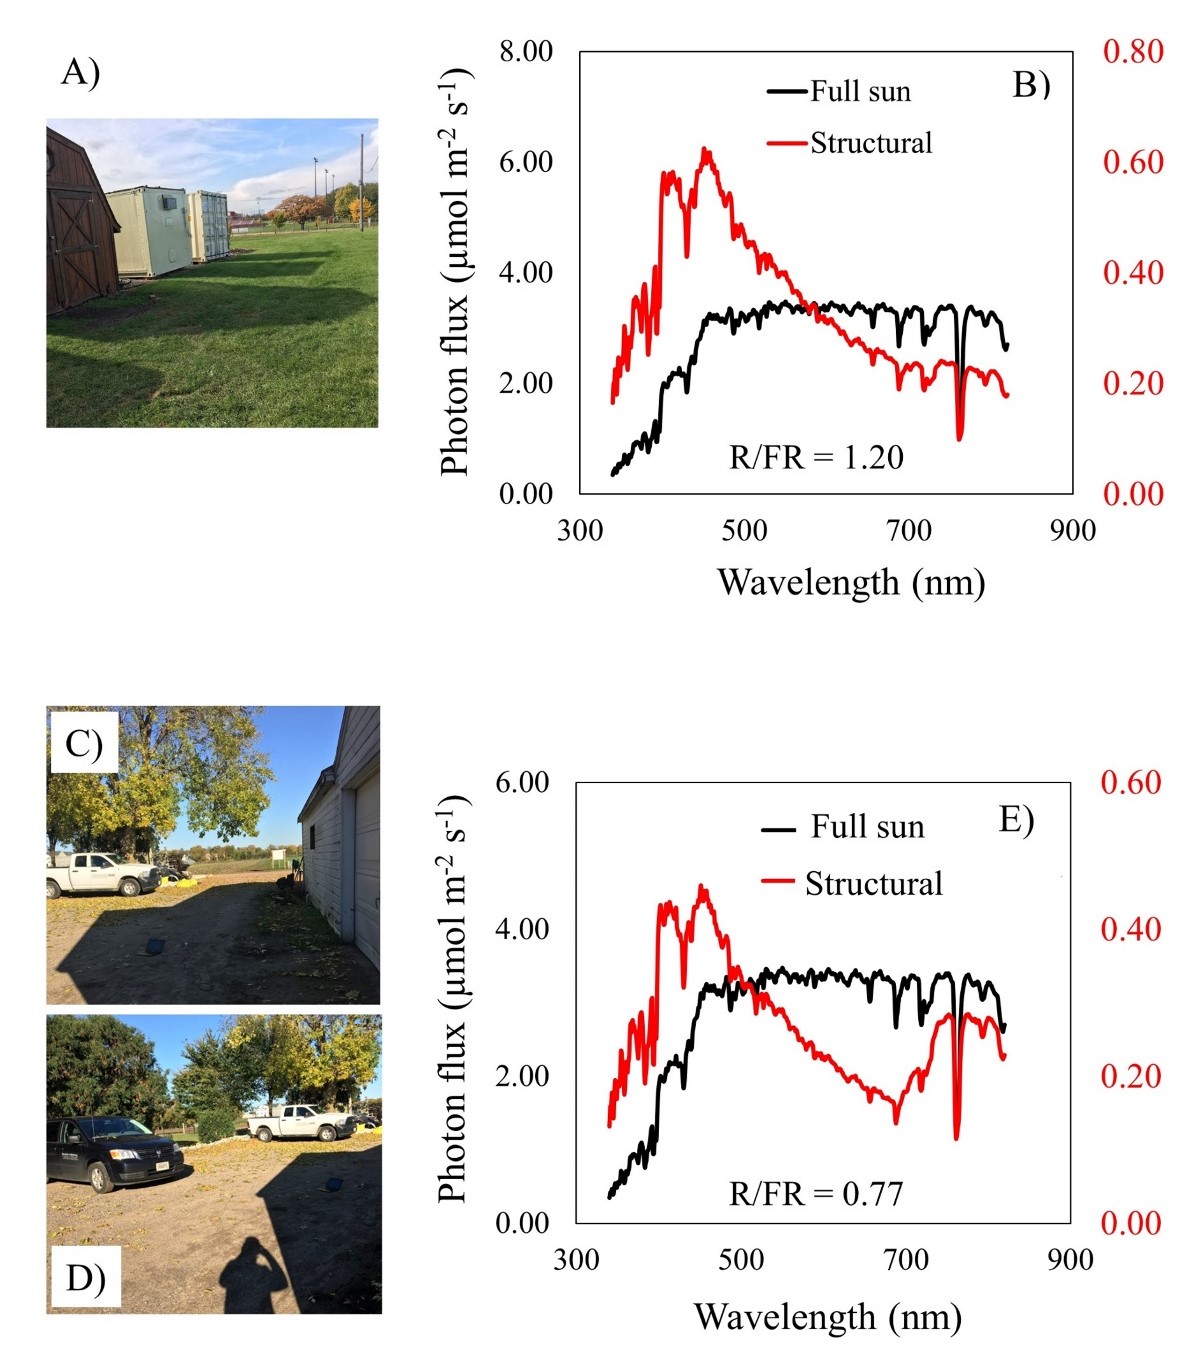
In the shadows of structures, changes to light are highly dependent on what’s nearby, similar to foliar shadows. In the shadow of the brown shed pictured in Figure 4A, we can see a change to the spectral distribution, similar to what we observed directly under a structure (Figure 4B). In this instance, we only see proportional changes in the amount of blue light, and the R/FR ratio stays near full sun conditions (Figure 4B). However, in Figure 4D, we can see a reduction in the R/FR ratio under the shadow of this building (Figure 4C). This reduction in the R/FR ration is similar to the type of reduction observed under trees or their shadows. We would normally not expect to see changes in the R/FR within structural shadows due to structures not selectively absorbing red light and reflecting far-red light, like leaves do. However, when we look at what’s nearby this structure, we can see that there are trees and shrubs to the north of this white building (Figure 4D). The trees are more than likely reflecting far-red light towards this white building, and therefore the white building is reflecting more far-red light into the shadow, reducing the R/FR ratio.
Overview
Light intensity isn’t the only thing that changes under shaded areas. It’s well understood that the spectral distribution of light changes directly under trees, with reduction in the R/FR very prominent (Holmes and Smith, 1977b). However, in more moderately shaded turfgrass areas we now know that there may be relatively greater amounts of blue light due to greater diffusion of these wavelengths. Under structures, most researchers focus on the reduction in light intensity, and the fact that the spectral distribution changes as well is often ignored. The fact that within shadows of structures relatively more blue light can be observed is not new (McKee, 1963), but we will be using this information to help breed turfgrasses that may be more adapted to utilizing blue light, and therefore perform better under these types of shade environments. Things get more complicated in shadows, and changes to light here will depend on the surroundings.
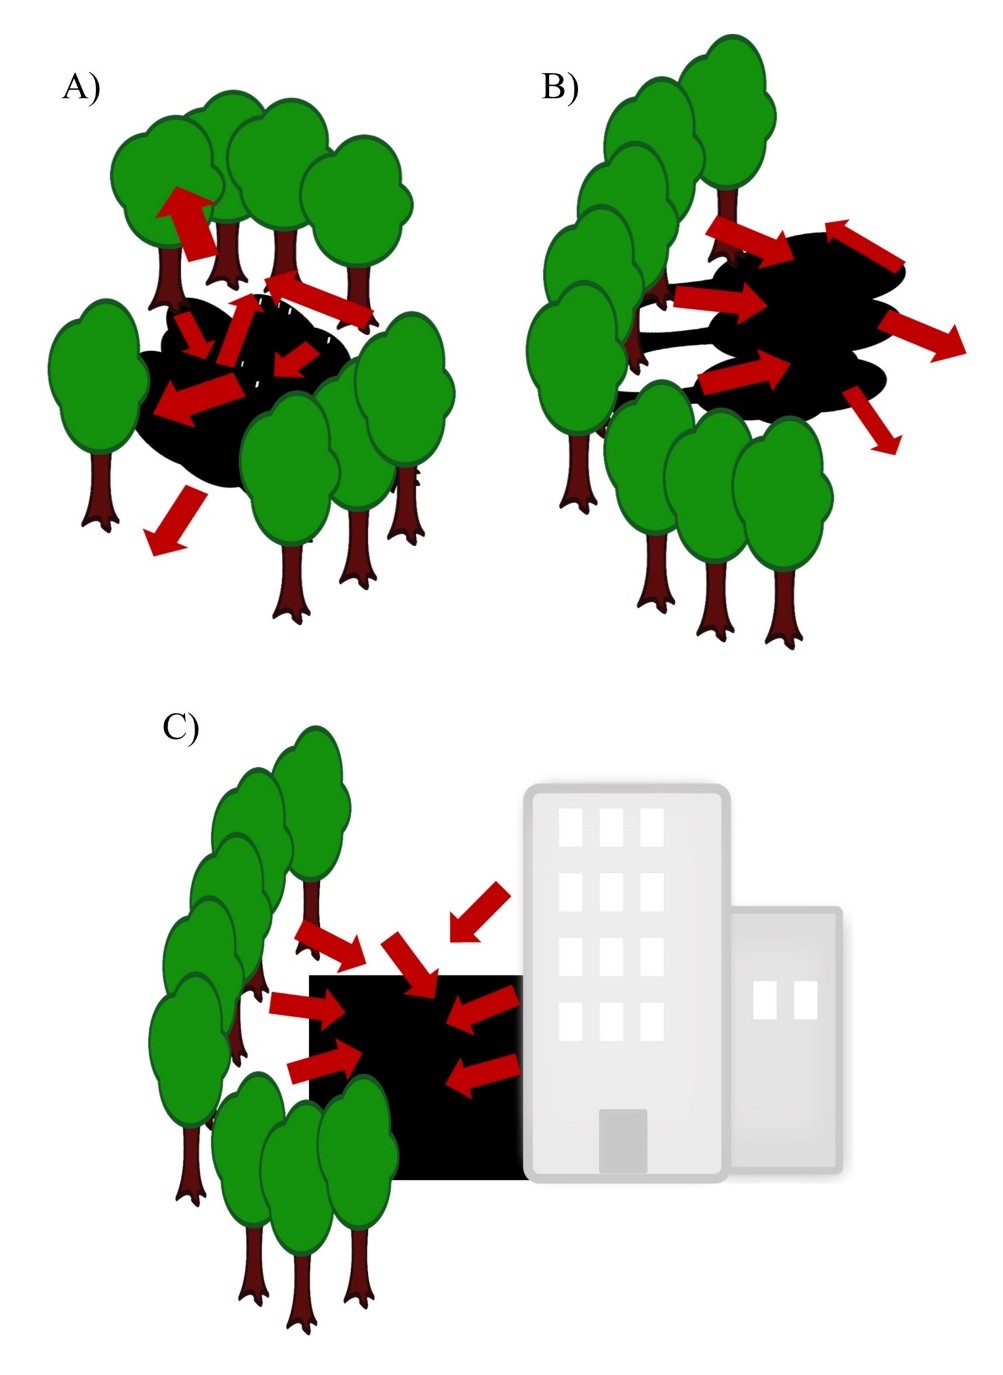
A shadow in the middle of an area that is surrounded by trees will have a spectral distribution that mimics changes observed directly under trees, due to scattering of far-red light back-and-forth among the trees (Figure 5A). However, if the shadow is surrounded by fewer trees or if one side is open, then the change to the light within this shadow may more resemble structural shade (Figure 5B). Changes to the light environment within shadows of structures mostly resemble changes directly under structures, but this can change if there is vegetation nearby (Figure 5C). A shadow in between a building and vegetation will have an altered spectral distribution similar to foliar shadows, with a reduction in the R/FR ratio, due to reflection of far-red light within the shadow by the building (Figure 5C). However, the color, type of paint, or type of material the building is constructed from could alter this, and more information is needed to better understand how light changes under these scenarios.
Acknowledgements
This project was supported by the National Institute of Food and Agriculture, U.S. Department of Agriculture, Specialty Crops Research Initiative under award number 2017-51181-27222.
References
Holmes, M.G. and H. Smith. 1977a. Function of phytochrome in natural-environment. 1. Characterization of daylight for studies in photomorphogenesis and photoperiodism. Photochemistry and Photobiology 25: 533-538. doi:DOI 10.1111/j.1751-1097.1977.tb09124.x.
Holmes, M.G. and H. Smith. 1977b. Function of phytochrome in natural-environment. 2. Influence of vegetation canopies on spectral energy-distribution of natural daylight. Photochemistry and Photobiology 25: 539-545. doi:DOI 10.1111/j.1751-1097.1977.tb09125.x.
McKee, G.W. 1963. Use of a color temperature meter to characterize light quality in the field. Crop Sci.: 271-273.
Young, A.T. 1981. Rayleigh-scattering. Appl Optics 20: 533-535. doi:Doi 10.1364/Ao.20.000533.
