By Dominic Petrella
Shade can be stressful for turfgrasses due to decreasing photosynthesis, causing turfgrass to produce leaves that are more susceptible to traffic damage and disease incidence. Turfgrasses grown in shade may not perform very well due to decreased density. While we understand that shade is stressful, it’s commonly forgotten that there are two different types of shade, qualitative shade and quantitative shade (both having different properties) that can lead to these detrimental changes in turfgrass growth. To better understand how qualitative shade and quantitative shade can effect turfgrasses, we first need to discuss how light is measured and evaluated.
Light quality and qualitative shade
Light quality is a description of the uniformity of wavelengths of light plants are exposed to. Light is a form of electromagnetic (EM) radiation emitted by the sun (and artificial light sources), and solar EM radiation includes a range of particles with different energies (Fig. 1). EM radiation can be defined by its wavelength, and wavelengths of solar EM radiation range from around 100 nm (ultraviolet light, UVC-A) to above 1,400 nm (near infrared light). Shorter wavelength EM radiation, like UV light, contains more energy compared to longer wavelength EM radiation, like near infrared light (Fig. 1). However, the majority of the solar EM radiation that enters our atmosphere is visible light, near infrared, and some UVA.
Plants utilize EM radiation between 400 – 700 nm for photosynthesis, and these wavelengths of light are termed visible light (because we can see them), or photosynthetic active radiation (PAR). Visible light between 400-500 nm is blue light, 500-600 nm is green light, and EM radiation between 500-600 nm is red light (Fig. 1). Plants only use visible light for photosynthesis, but other types of light can influence plant growth as well. One of the most well-known examples is far-red light. Far-red light includes wavelengths slightly longer than 700 nm (Fig. 1), and wavelengths near 740 nm affect plant growth the most.
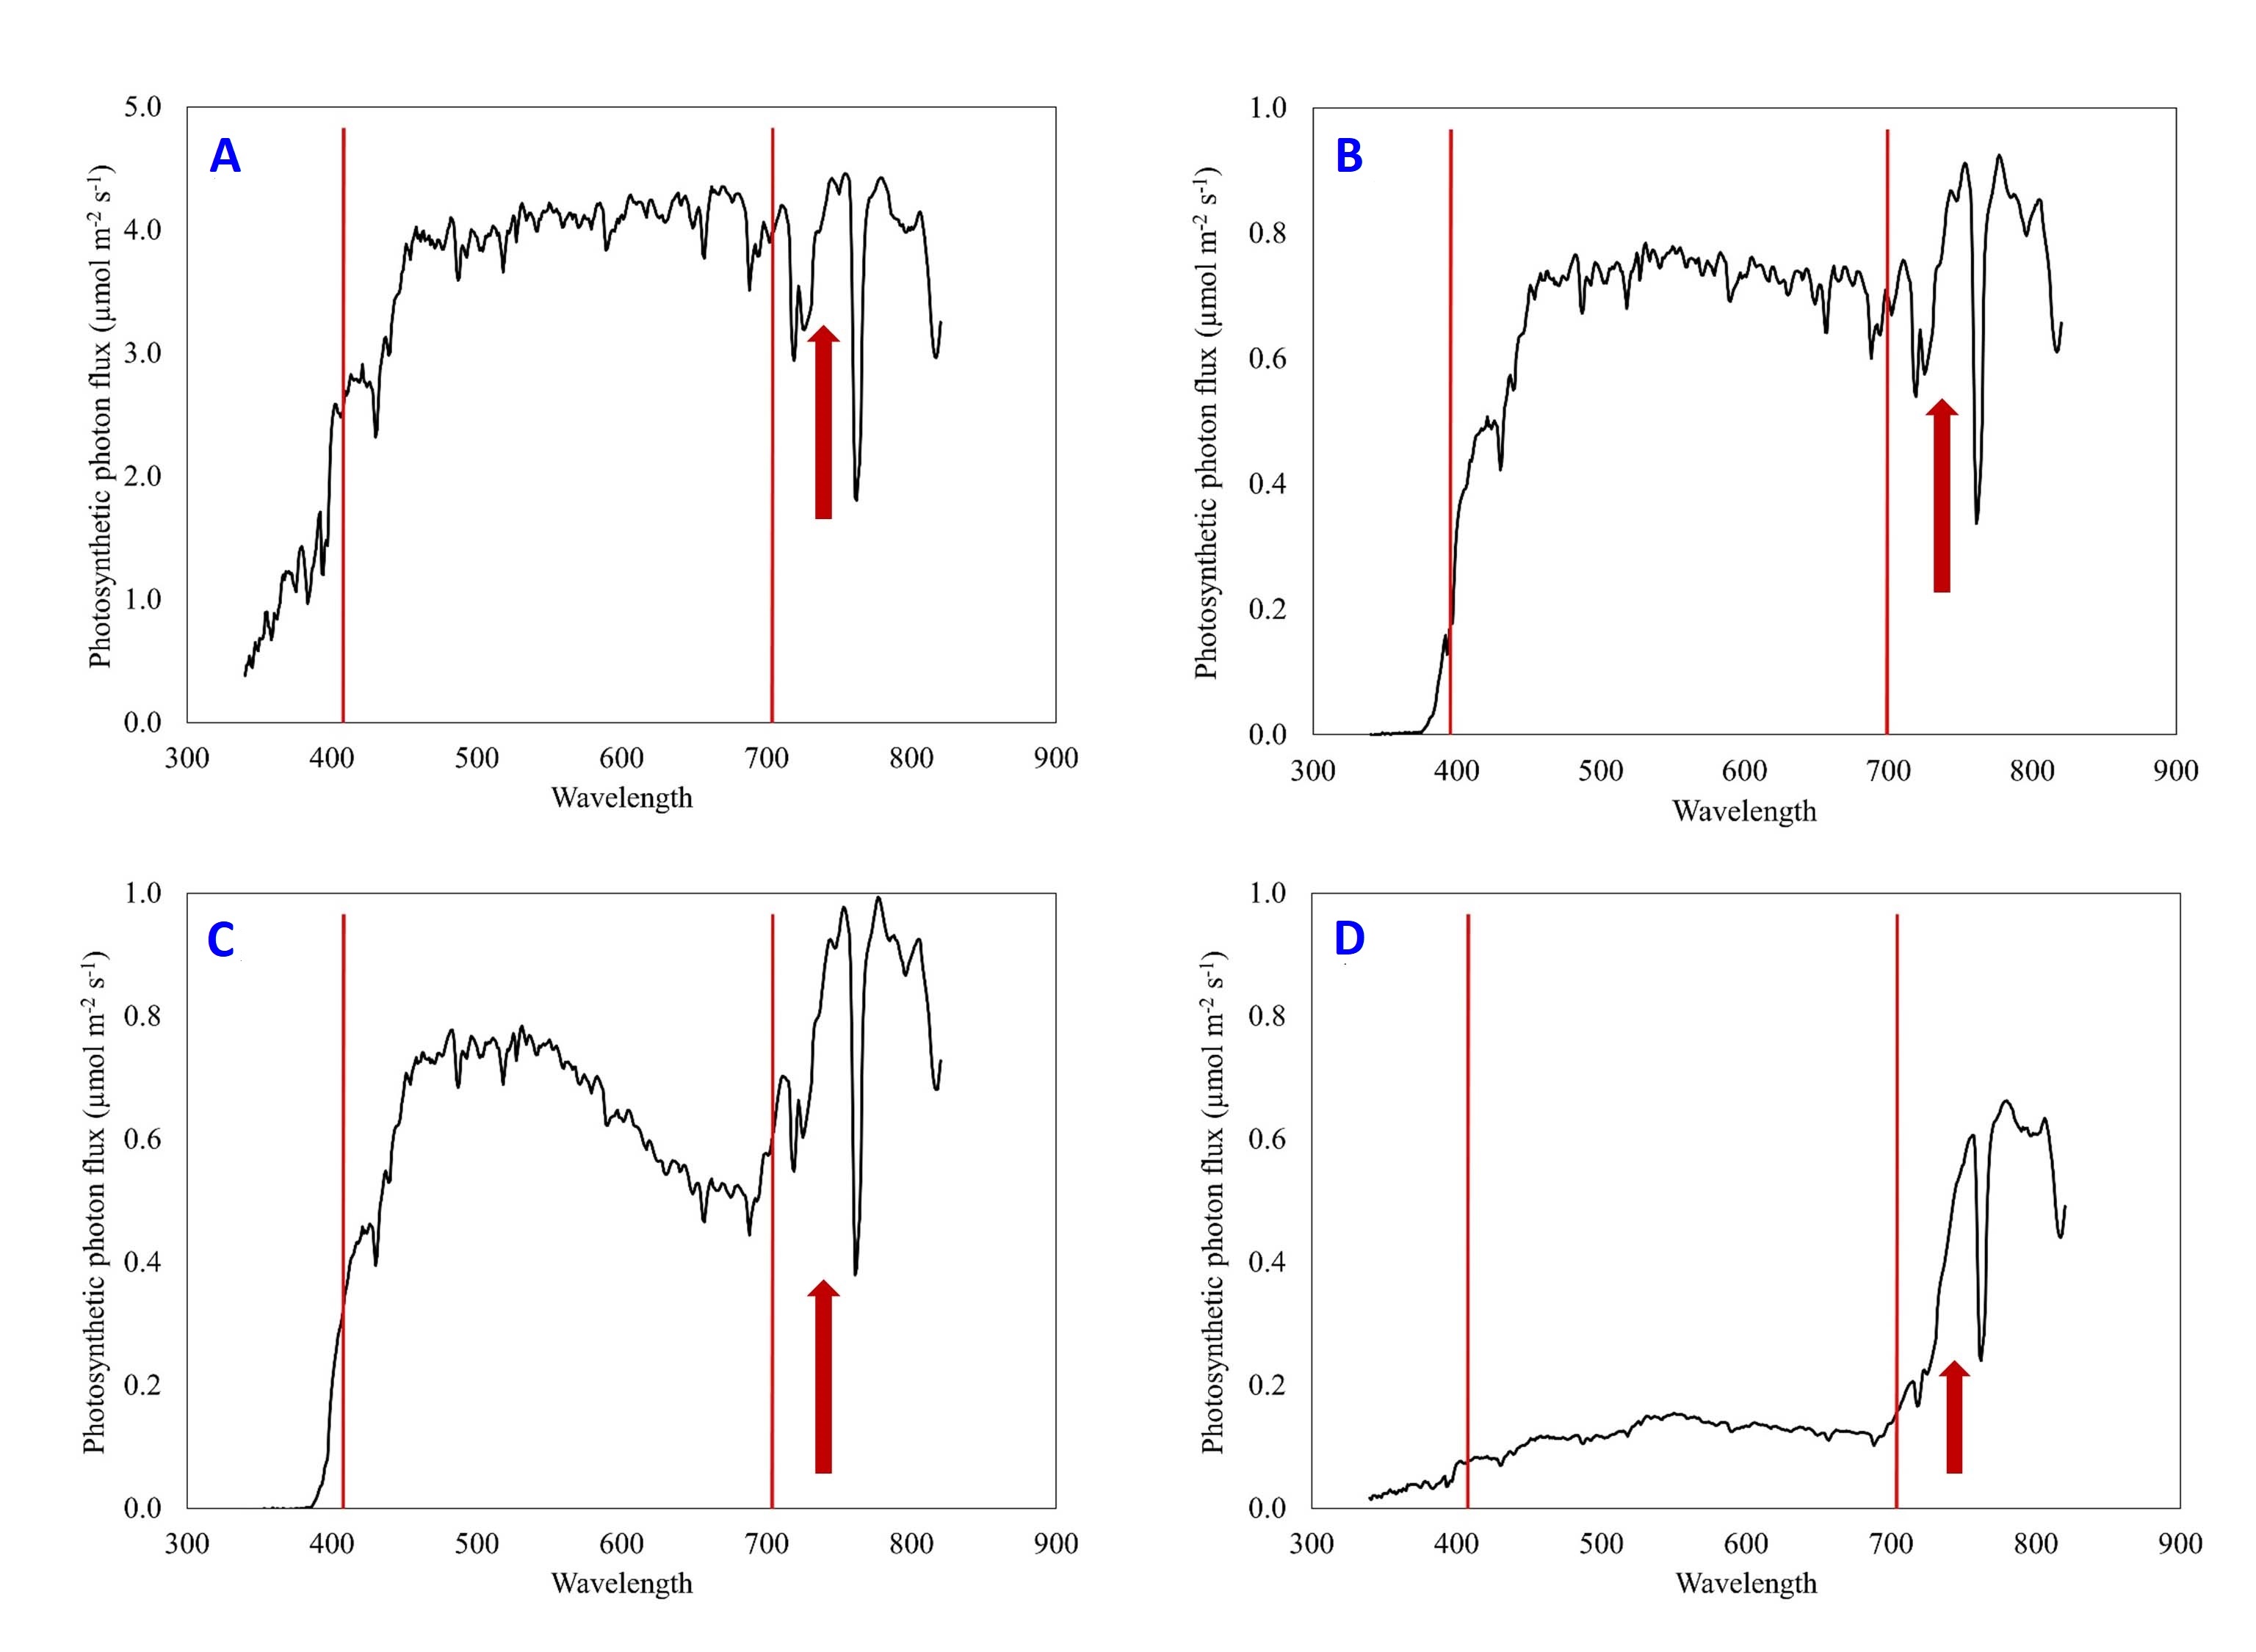
We can observe the quantity and uniformity of individual wavelengths of light (ultraviolet, visible, infrared, etc.) using an instrument called a spectroradiometer, and produce graphs that show the quantity of individual wavelengths, called spectral distribution graphs (Fig.2). In Fig. 2A we can see the spectra of natural sunlight without any shade. The x-axis of these graphs represent the wavelengths of light from 300-900 nm, and the y-axis indicates the quantity of the wavelength of light. When looking at wavelengths between 400 – 700 nm (between the red lines), we can see that there are relatively equal amounts of blue, green, and red light. We can also see that the amount of far-red light (area above red arrow) is similar to the amounts of visible light under natural sunlight, or even in slightly less quantity. For plant growth, poor light quality is generally defined by light that has a lower proportion of red light to far-red light, and this is because plants specifically “see” and respond to the ratio of red to far-red light.
Plants are able to see their environment using molecules called photoreceptors (we also have photoreceptors in our eyes). Photoreceptors absorb specific wavelengths of light, and after absorbing this light the photoreceptor will send out signals within the cell that inform the plant about current light conditions, thereby allowing the plant to adjust its growth to match the environment. When there is more far-red light present compared to red light, a photoreceptor called phytochrome will signal within the cell to change growth to adapt to shade conditions, and the more far-red light compared to red light will produce more drastic changes in the plant. The ratio of red to far-red light under full sunlight is between 1.1 – 1.2, and when the ratio begins to drop below 0.8 we will observe changes in turfgrass growth.
The amount of far-red light turfgrasses are grown in can vary quite a bit depending on the type and amount of vegetative shade it is under. In Fig. 2B, we can see that the peaks of far-red light are greater than other peaks of visible light, resulting in decreased light quality and a ratio of red to far-red light that is less than 1.0. However, Fig. 2B shows a small change in light quality that will not affect turfgrass growth. Fig. 2C and 2D show exacerbated examples of poor light quality, where there is much less red light compared to far-red light, producing red to far-red ratios below 0.6.
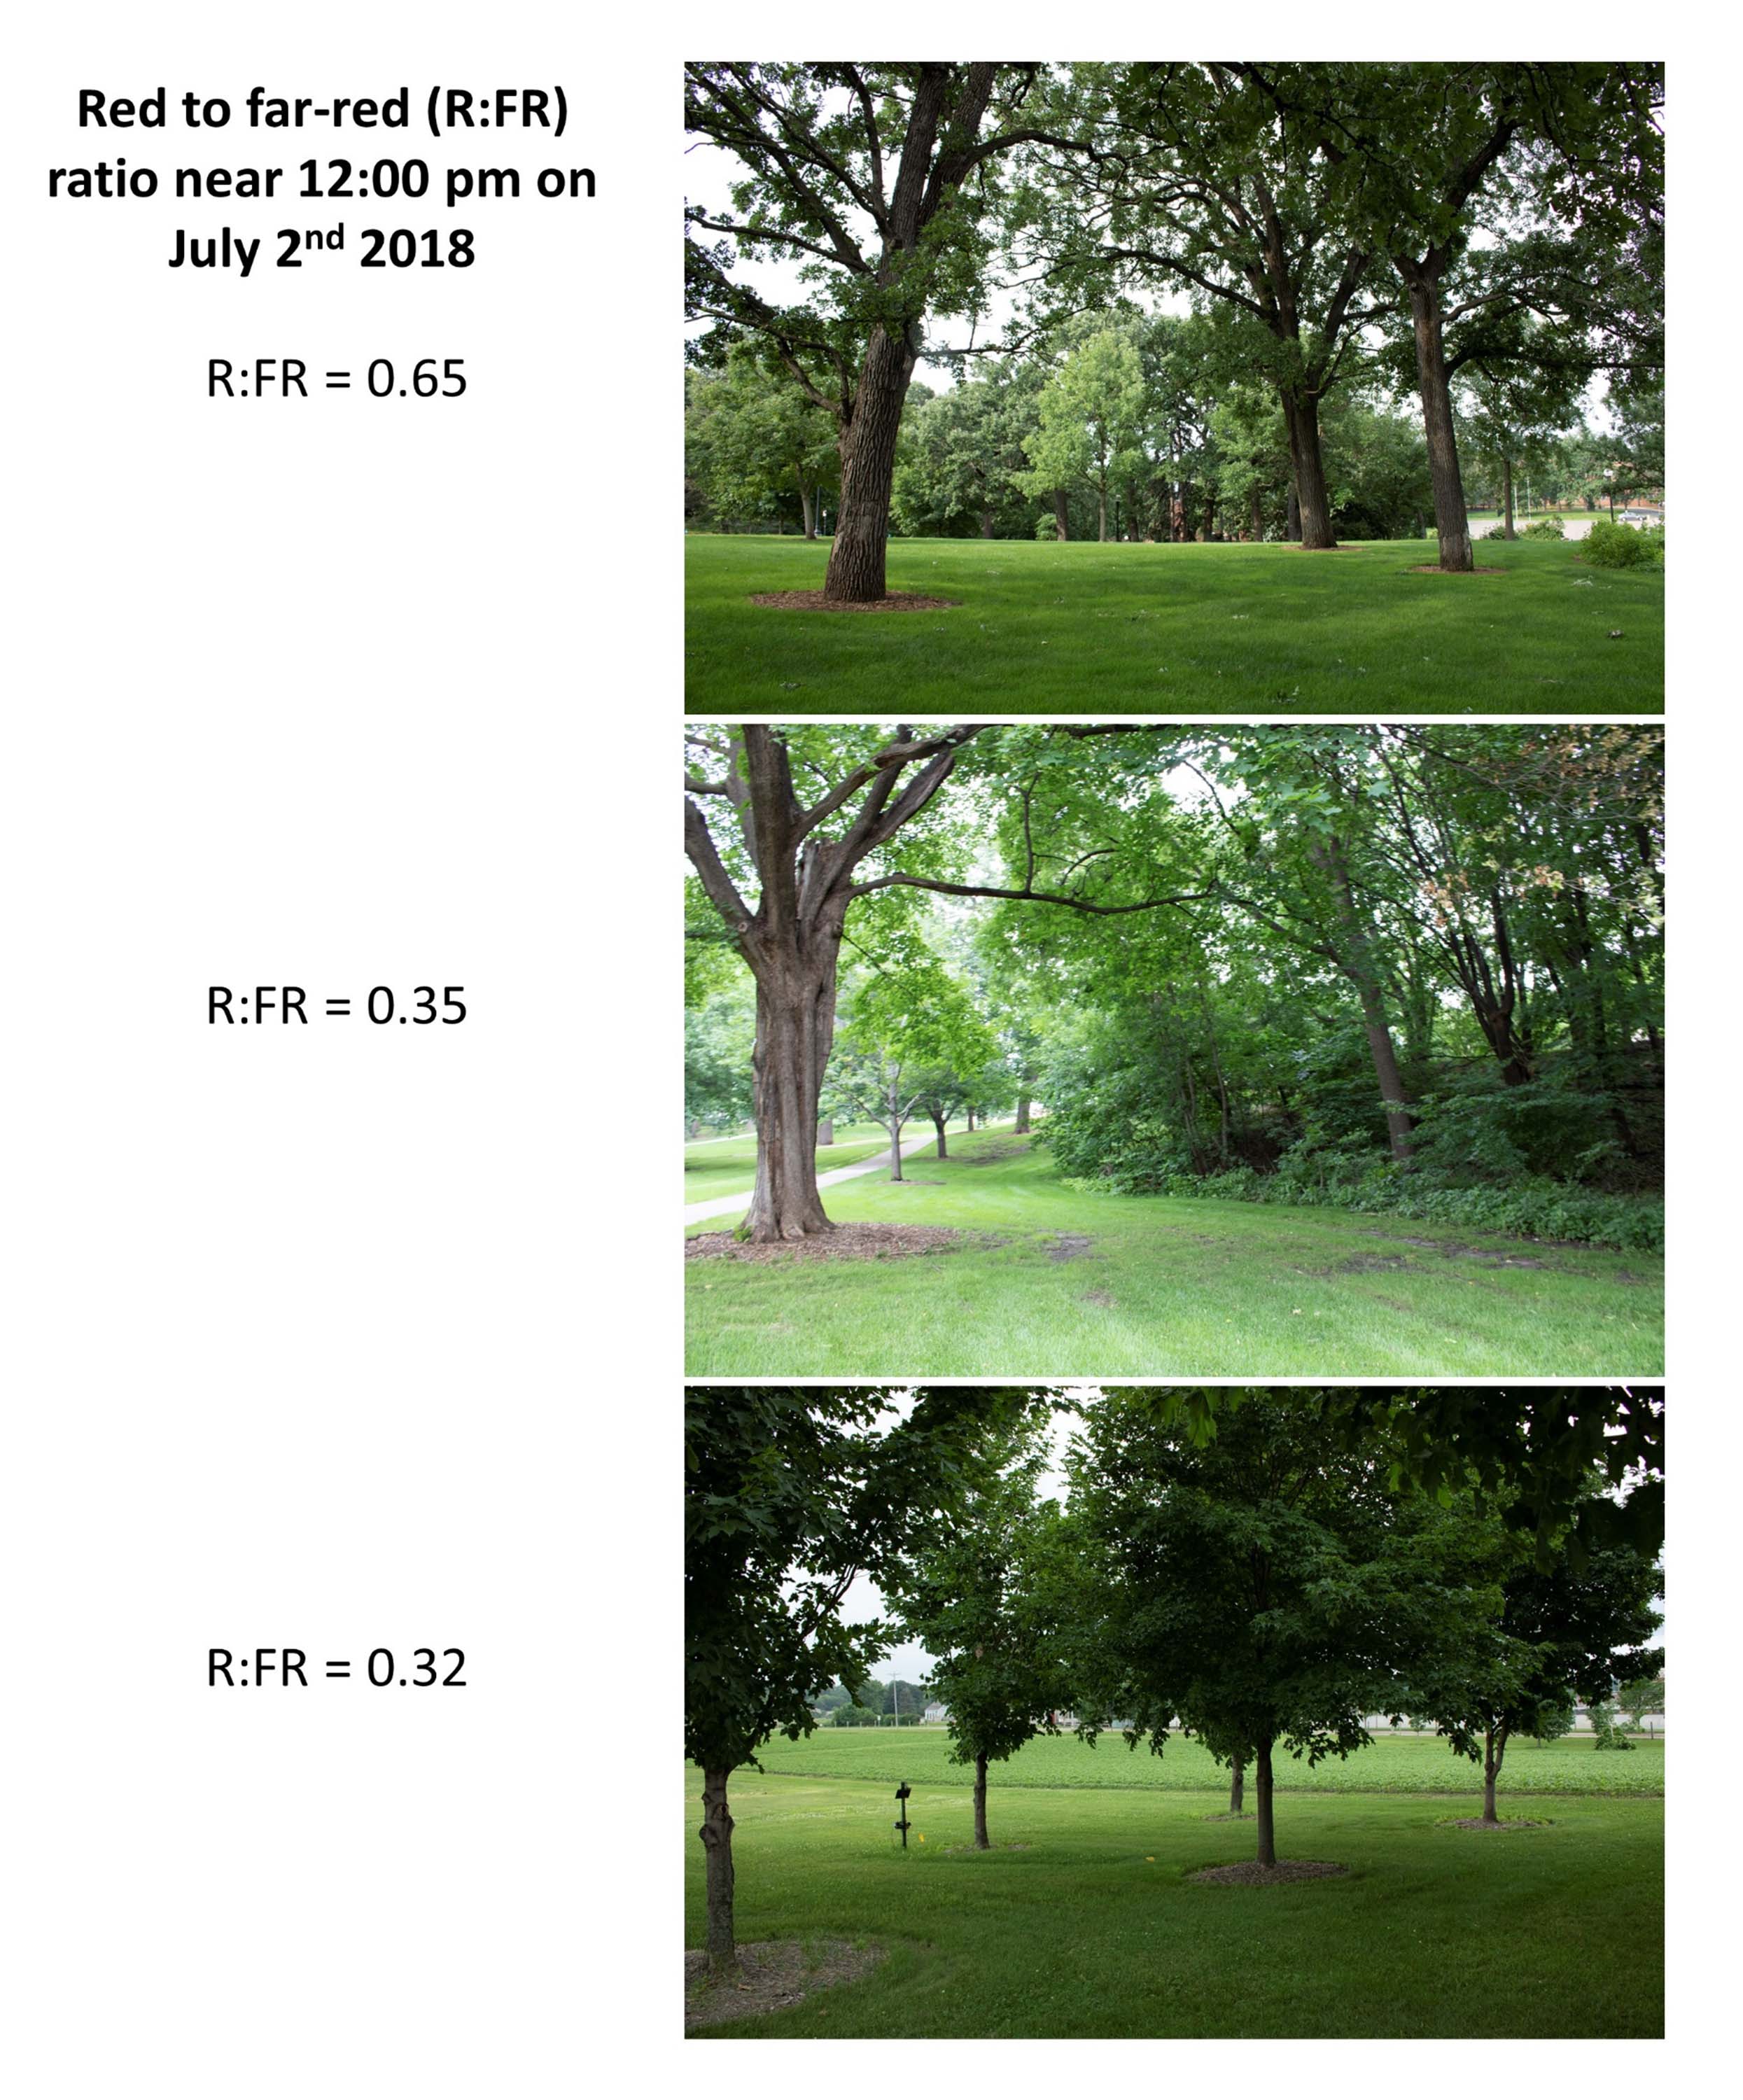
Light that has a low red to far-red ratio, like in Fig. 2D especially, can drastically decrease turfgrass quality, in particular decreasing tillering, increasing leaf elongation, decreasing the thickness of the leaves, and decreasing the amount of chlorophyll. This change in light quality occurs under vegetative shade only, and low red to far-red ratios can also even occur if the amount of shade doesn’t seem to be that bad. Turfgrasses are exposed to light that has a reduced red to far-red ratio when there are trees or shrubs shading the turfgrass area below. The trees and/or shrubs will absorb the red light for photosynthesis, but will either reflect or transmit the far-red light. This results in light that is enriched in far-red light relative to red light, and overall reducing light quality. We can observe large changes in the red to far-red ratio under different types of vegetative shade (Fig. 3). Typical turfgrass shade areas may have red to far-red ratios near 0.65 during part of the day, while more extreme areas can have ratios as low as 0.35 (Fig. 3). These areas also have reduced levels of light as well that can add to turfgrass stress. In the next blog, we will discuss measuring light quantity and understanding how to think about these data.


