By Garett Heineck
Visual assessment of turfgrass stands is done, intentionally or passively, by anyone who owns or maintains lawns. Turfgrass scientists, golf course superintendents and sports field managers intentionally collect data on turf for various purposes, while homeowners may casually observe their lawns making only mental notes. For example, a scientist or golf course superintendent may deliberately record the amount and location of winter kill or disease. Homeowners, on the other hand, may casually observe these same characteristics while walking through their own yards. Either way visual observations of turfgrass lead to data accumulation that drives decisions made by all managers. Scientists often use this data for variety selection or agronomic trials, while golf course superintendents may learn if disease is spreading on a putting green. Homeowners, when observing their lawn in early spring, may find they need to buy seed for overseeding dead patches in their lawn.
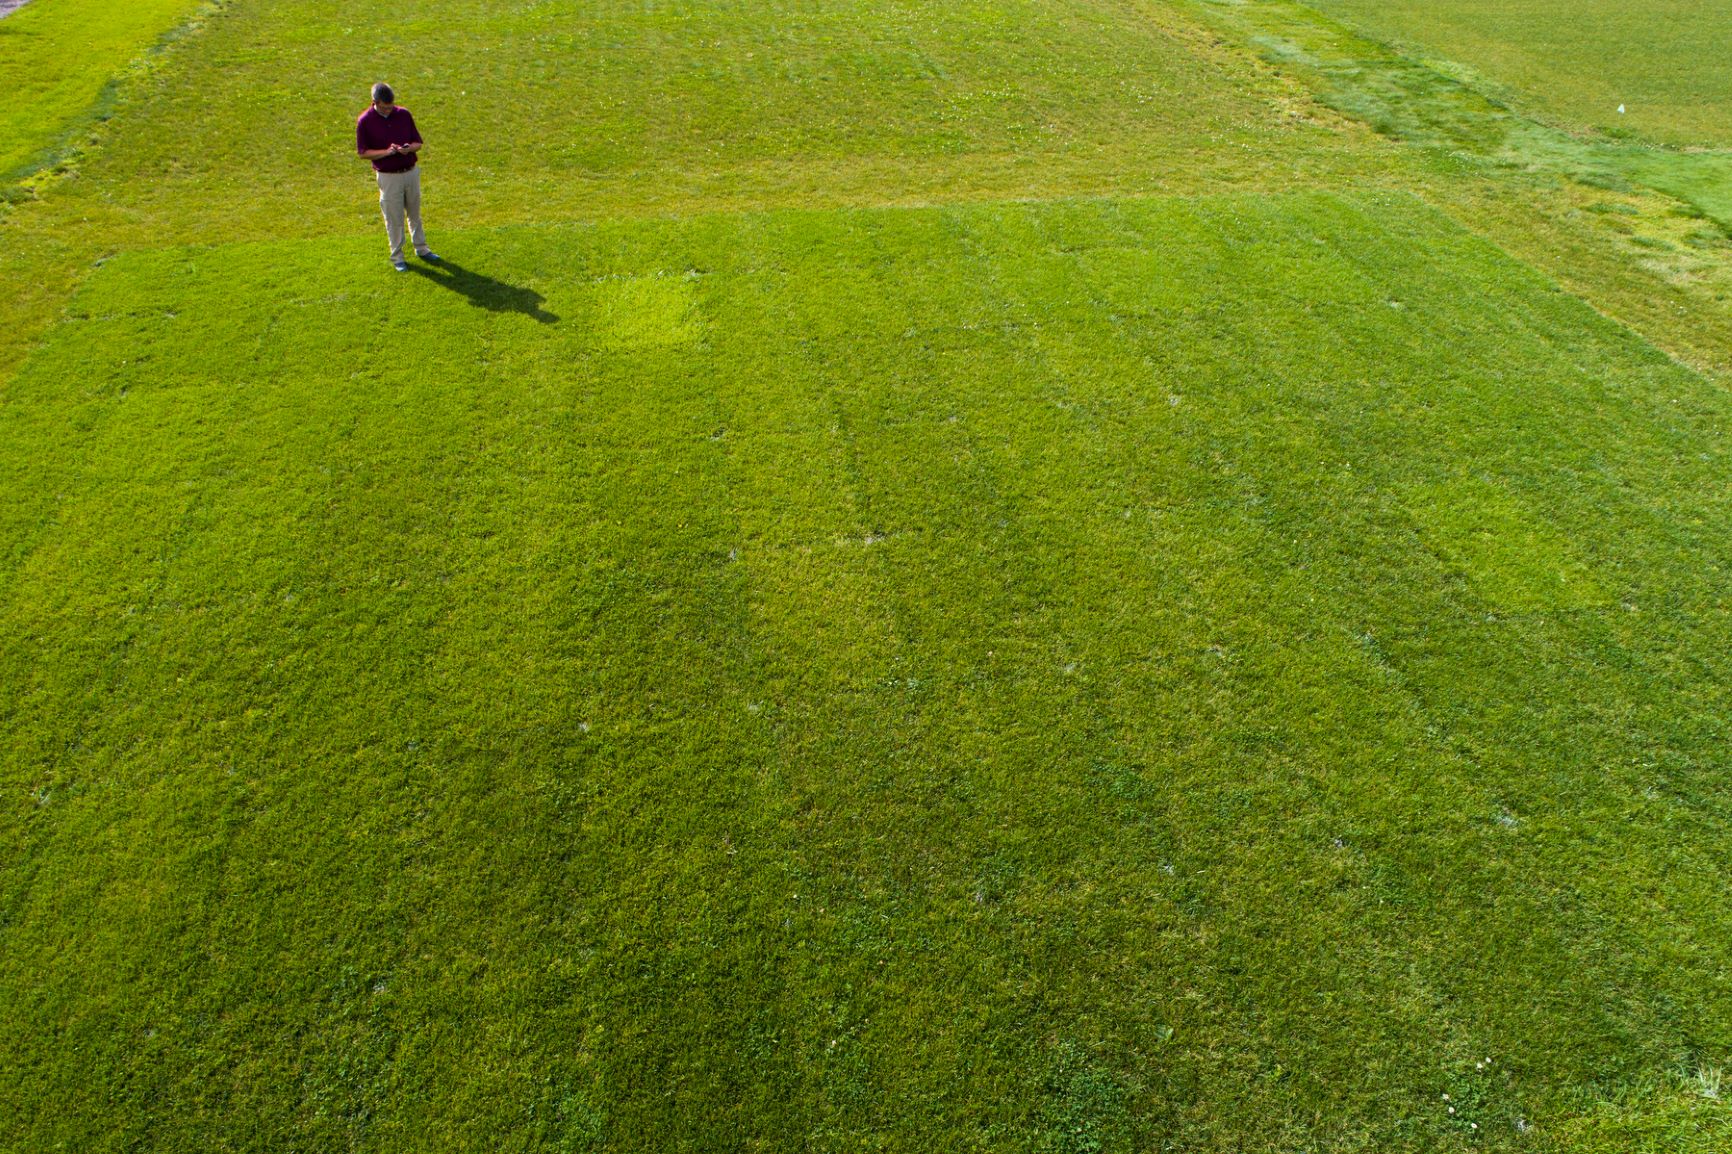
Automated data collection methods can replace visual assessment of several traits such as winter survival and disease incidence For instance, precision management of green spaces, such as implementing smart irrigation controls, has made visual assessment of drought obsolete in many cases. With the increased use of smartphones capable of saving thousands of high quality images and affordable drones with imaging capabilities, all managers can record the aesthetic quality of a green space through digital imaging.
Once managers have collected images of their lawn or research area, there are several image processing options available depending on the data the manager wants to collect. For example, the percentage of green turf canopy, called “percent living ground cover” by scientists, is important for gauging winter survival and turf health under high temperatures. This blog post covers most of the common image analysis systems, both open source and commercial, designed for agriculture and horticultural systems.
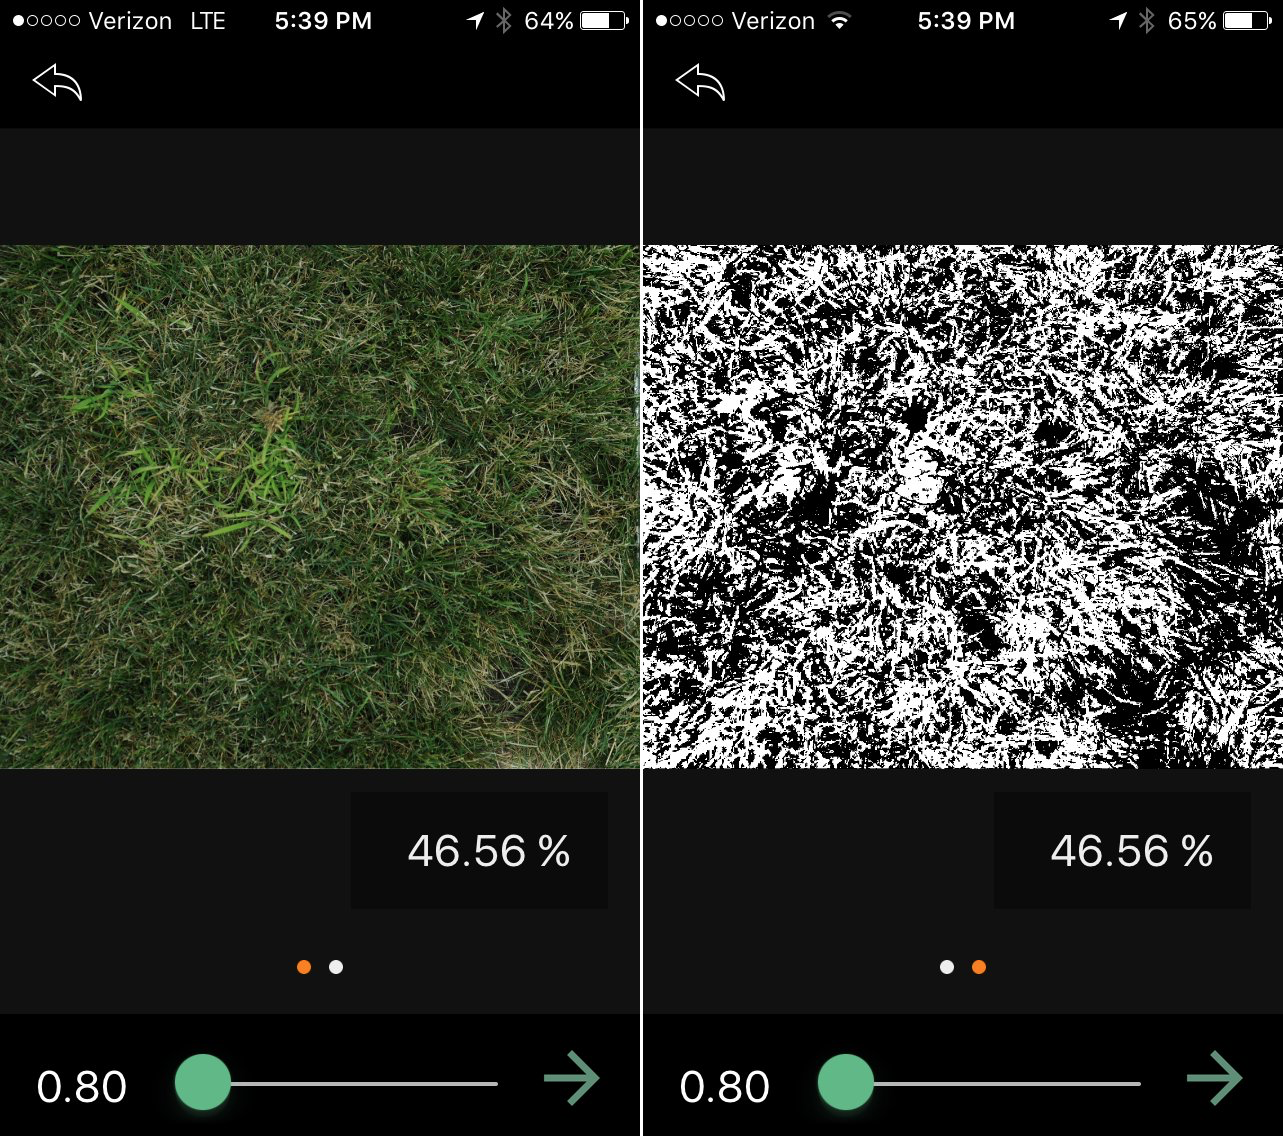
Turfgrass scientists often use image analysis to collect quantitative data that is less subjective than visual ratings. Because image analysis is increasing in use, systems for processing images have become more prevalent and easier to use. Two open source programs that can be applied to a wide range of variables, such as green cover, are ImageJ and Program R. Of these two, ImageJ is far more user friendly due to a multitude of downloadable functions for image analysis and a graphical user interface (Abràmoff et al., 2004). R is much more difficult to use because it requires knowledge of the R coding language, but it is capable of processing much larger datasets and offers a wide range of analysis functionality (R Core Team, 2018). A third open source and more user friendly option is an application called Canopeo (Patrignani and Ochsner, 2015). This free app is incredibly user friendly and can be downloaded directly onto a smartphone,for both iOS and Android operating systems, through the app store on your device. The downside to this app is that is only useful for detecting green cover and cannot be trained on other variables such as disease presence.
Managers willing to pay for licensing and looking for a more user friendly method to determine disease severity may be interested in ASSESS software (Lamari, 2002). This program is hosted by the American Phytopathological Society and is very useful for determining disease severity on grasses. A second commercial software specifically for turfgrass is the Turf Analyzer (Karcher et al., 2017). This software is also very user friendly and was designed to measure turfgrass traits such as color, density and general turf quality. Its functionality would also likely allow rough estimates of disease severity if the user set parameters correctly. Both of these programs require a small annual fee, but to many managers and scientists this may be well worth the time savings in learning more complicated open source programs.
In my next post, I will introduce an interesting new way to quantify weed cover using R software.
References
Abràmoff, M.D., P.J. Magalhães, and S.J. Ram. 2004. Image processing with ImageJ. Biophotonics International 11(7): 36–42.
Karcher D.E. , C. Purcell, M. Richardson, L. Purcell and W. Kenneth. 2017. New Java Program to Rapidly Quantify Several Turfgrass Parameters from Digital Images. CSSA Oral presentation. https://scisoc.confex.com/crops/2017am/webprogram/Paper109313.html.
Lamari, L. 2002. Assess: image analysis software for plant disease quantification. APS press.
Patrignani, A., and T.E. Ochsner. 2015. Canopeo: A Powerful New Tool for Measuring Fractional Green Canopy Cover. Agronomy Journal 107(6): 2312–2320.
R Core Team. 2018. R: A language and environment for statistical computing. R Foundation for Statistical Computing, Vienna, Austria.

