By Jillian Turbeville
Oftentimes, when thinking of a fantastic-looking lawn a person may envision a lush, green mat of turfgrass spread evenly across a front and back yard. However, the effort and resources put into this outcome are often unrealistic and simply not sustainable for most people and for the environmental goals of the community. After dry spells in Minnesota, lawns begin to lose their color, the leaves begin to wither, and the plants turn to dormancy unless given adequate irrigation. To investigate this problem, our team is researching, as part of a grant funded by the Metropolitan Council, whether different turfgrass mixtures show better drought tolerances and if an application of mycorrhizae assists in better water retention.
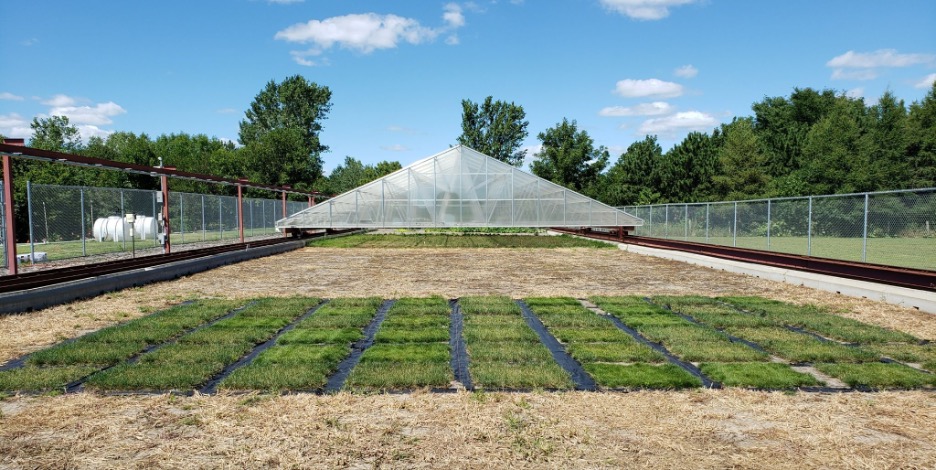
The study consisted of two 30-day drought periods and two 30-day recovery periods taking place in the summer of 2021 and 2022. We tested both monocultures of Kentucky bluegrass, perennial ryegrass, and hard fescue, along with several mixtures of any two of these in 2:1 ratios by pure live seed (66% hard fescue: 33% perennial ryegrass, for example). Each plot was tested with and without mycorrhizae applied. For this project, we used a moving rainout shelter (Figure 1) to assist us in keeping the plants dry as we moved the structure over the plots when needed.
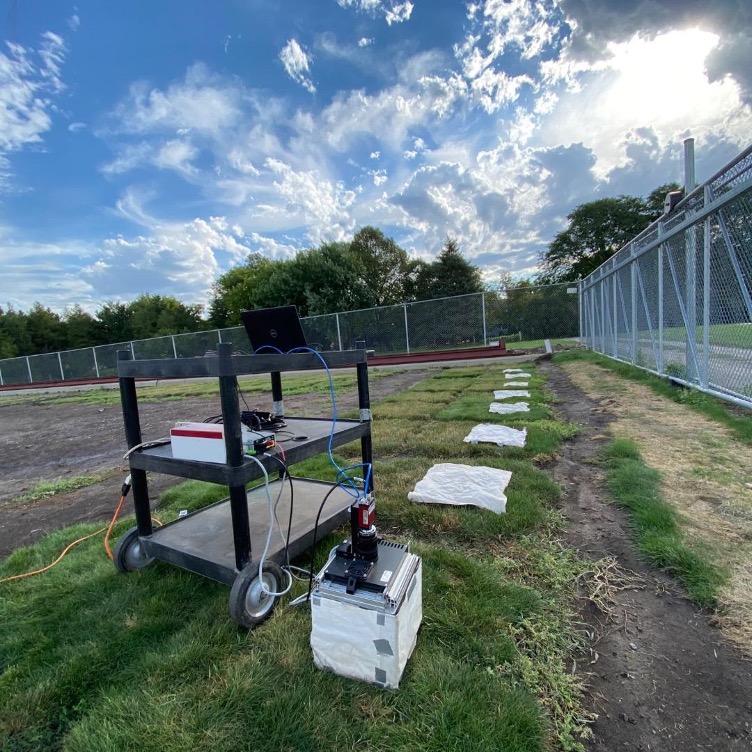
Data collection for this project includes plant stress indicators like Fv/Fm as evidence of plant photosynthetic performance using a fluorometer (Figure 2) and normalized difference vegetation index (NDVI) testing the presence of live green vegetation. The volumetric water content percentage (VWC%) was measured to understand the rate at which the plot dries over the drought period. Light box pictures and species composition data were also collected. Using the light box pictures, we can not only visually see differences between drought and recovery, but we can also analyze the photos for features like percent green or percent purity. Species composition analysis uses a counting system on a grid structure to get an objective look at the species of turf within a mixture.
The results showed that hard fescue was the most drought tolerant and most prevalent in any plot that included the species at the initial seeding. Mixtures with hard fescue had the highest percent green throughout drought/recovery and stayed the most consistent in terms of percentage within species growth. Even if a mixture started with a lower percentage of hard fescue, by the end of the study the hard fescue would dominate.
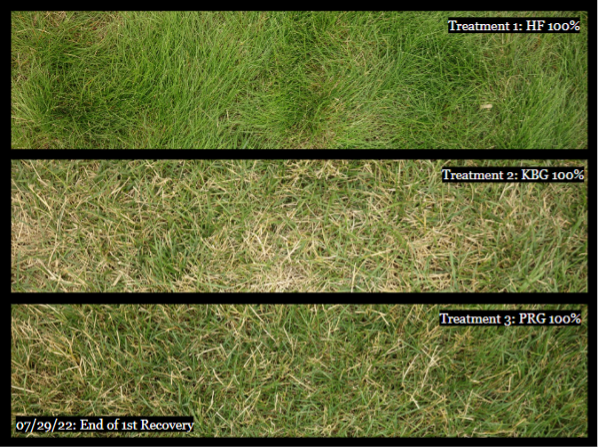
At the end of the first recovery, hard fescue displayed the best condition (Figure 3). This is also evident in the stress indicators such as the fluorometer. Intense stress hampers a plant's ability to metabolize, grow, and develop; being able to quantify this helps us to understand which plots are recovering even without a visual indicator. The Fv/Fm captured at the end of the first recovery found that hard fescue dominated mixtures had the highest Fv/Fm spectral value indicating lower stress levels with an average of 0.729, the lowest values belonged to perennial ryegrass dominated mixtures with an average of 0.646, and Kentucky bluegrass dominated mixtures had an average 0.710.
For normalized difference vegetation index (NDVI) we found that hard fescue trends higher for live green vegetation over time. When comparing the end of the first recovery and the end of the second recovery (Figure 4), all dominant mixtures show a significantly different value. Hard fescue increases in NDVI value over time, suggesting that the species can recover well. Mycorrhizae did not improve the plants ability to counteract drought stress or improve water holding capacity.

As the need for drought-tolerant lawns becomes more prevalent in our movement for healthier environmental practices, I hope that our research being done in collaboration with the Metropolitan Council makes a difference. As we continue to analyze the data we have collected from our last two summers, I hope to find clearer results on drought-tolerant species and use this new knowledge to help others find sustainable seed options for their lawns.