By Chase Straw
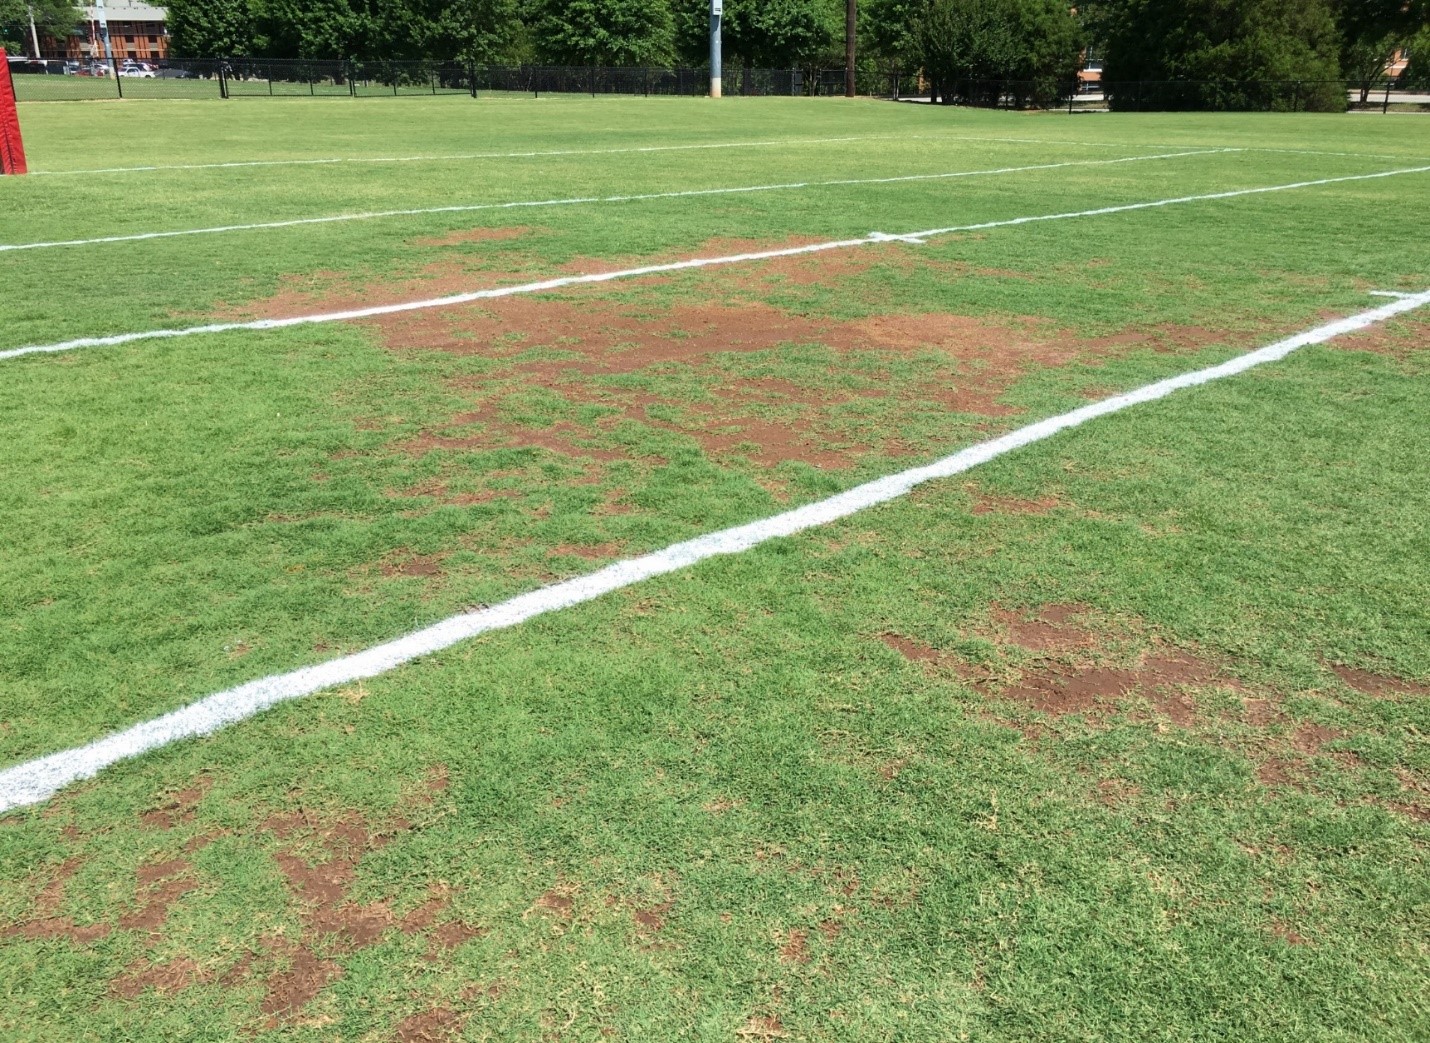
Natural turfgrass sports fields vary in properties, such as soil moisture and surface hardness, due to weather conditions, field construction, field management, and foot traffic patterns from field usage (Figure 1). Because fields are not uniform, natural variation could influence playing surface predictability and require athletes to make abrupt or frequent adjustments that lead to increased injury. GPS-equipped sampling devices are becoming common in the turfgrass industry for creating spatial maps to visualize changes in a field. Maps are currently used to suggest site-specific management strategies (i.e. applying management inputs where, when, and in the amount needed), but they may also be useful for evaluating how within-field changes affect athletes.
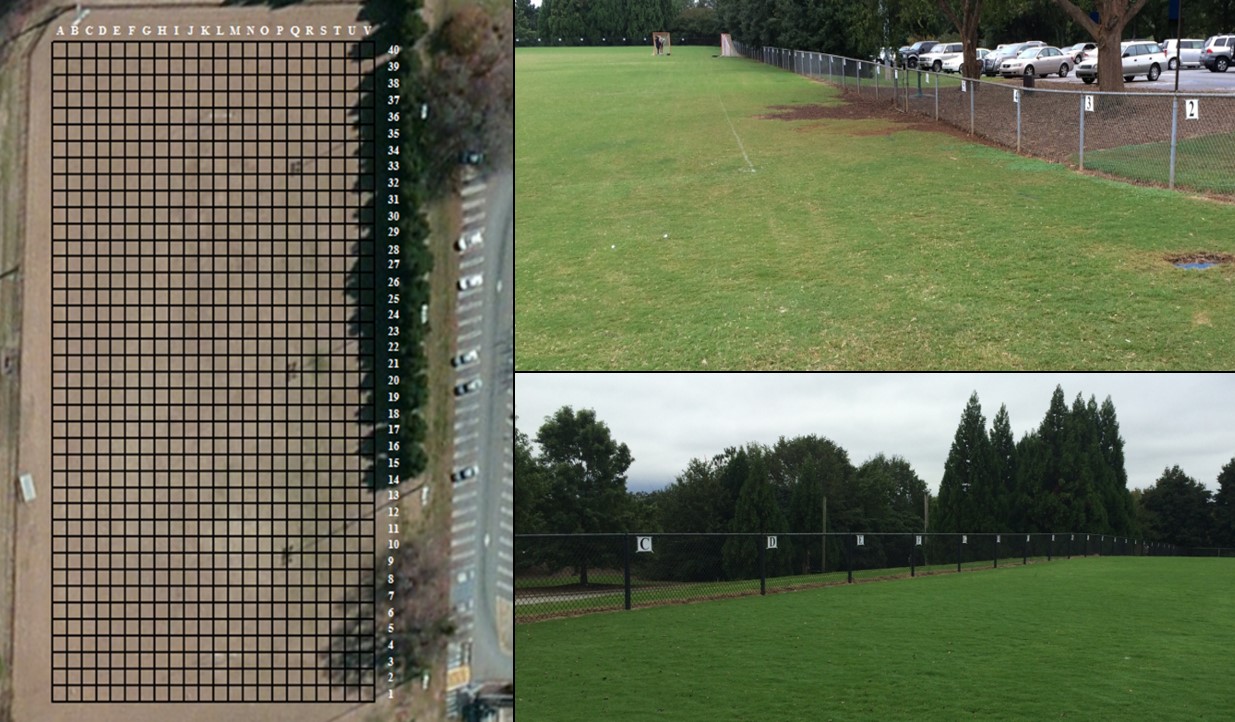
A two-year study was conducted at the University of Georgia (UGA) to determine the influence of within-field changes on ground-related injury occurrence. Participants were UGA Club Sports athletes from men’s and women’s rugby and ultimate frisbee teams, as well as the women’s lacrosse team. The study took place at the teams’ home fields at UGA (two bermudagrass fields). An alphanumeric grid was created over the entirety of each field that consisted of 10-by-10 foot cells. Letter and number signs were hung along a fence in the fields that corresponded with each cell (Figure 2). Weekly surveys were sent to athletes via email for them to self-report injury information, along with the cell location where the injury occurred. Injury was defined for the athletes as a physical complaint (pain, discomfort, etc.) that resulted from practice or competition (whether they sought medical treatment or not). Only injuries that were deemed directly caused by the ground were considered in the study.
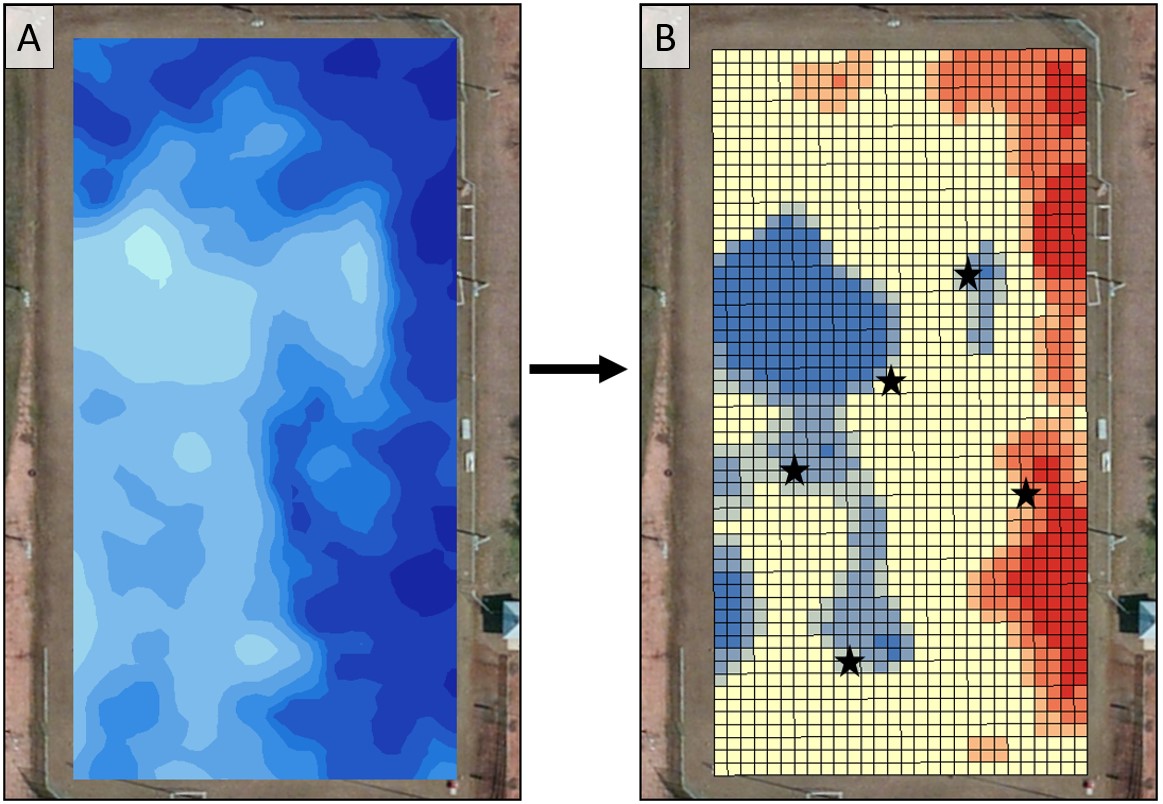
Soil moisture, turfgrass quality (i.e. green color and density, as measured by normalized difference vegetation index), surface hardness, and turfgrass shear strength (i.e. rotational traction) were measure either weekly or bi-weekly on each field. Data were averaged by month and spatial maps were generated (Figure 3A). Hot spot analysis was conducted to identify significant high (i.e. hot spot) and low (i.e. cold spot) values within the fields with respect to each map of the measured properties. For example, a hot spot of soil moisture would indicate a significantly wet area in the field, while a cold spot would indicate a significantly dry area in the field; likewise, a hot spot of turfgrass quality would indicate an area with significantly more green color and turfgrass density, while a cold spot would indicate an area with significantly less green color and turfgrass density (and so forth for surface hardness and turfgrass shear strength). Self-reported injury locations from a given month were overlaid with that month’s hot spot maps to determine if injuries caused by the ground occurred in areas of hot or cold spots (Figure 3B).
Twenty-three ground-related injuries were reported over the two years. The highest percent of injuries occurred within a hot or cold spot of turfgrass quality (79%), followed by soil moisture (76%), and then surface hardness and turfgrass shear strength (57%). The percentage of injuries occurring in cold spots of turfgrass quality (52%) was statistically higher than the percent area of the fields that were cold spots (20%). Conversely, the percentage of injuries occurring in hot spots of soil moisture (43%) was statistically higher than the percent of the fields that were hot spots (21%). This indicated that injuries were occurring more frequently in areas of low turfgrass quality and high soil moisture (relative to other areas within the fields).
Interestingly, a noticeable trend of injuries occurring along edges of hot and cold spots was observed with respect to turfgrass quality (11/15 injuries), soil moisture (14/16 injuries), and surface hardness (9/13 injuries) (Figure 3B). Therefore, with respect to these field properties, transitioning from “average” areas to high or low valued areas may pose a higher risk for injury compared to the risk of an injury occurring fully within a high or low valued area.
These results demonstrate the importance of maintaining uniformity within turfgrass sports fields, perhaps with site-specific management (i.e. aerification, irrigation, etc.) or by better monitoring and modifying field use. Similar research will continue fall of 2018 at the University of Minnesota, where athlete performance (monitored with wearable GPS athlete tracking devices) and injuries will be compared to field conditions within the field and over time.
Reference
Straw, C.M., C.O. Samson, G.M. Henry, and C.N. Brown. 2018. Does variability within natural turfgrass sports fields influence ground-derived injuries? Eur. J. Sports Sci. doi: 10.1080/17461391.2018.1457083.


