By Joan M. Barreto Ortiz
Collecting environmental data and monitoring your research projects can require lots of resources. Growing conditions in greenhouses, chambers, and any other controlled environment, vary from outdoor climates and that variation needs to be accounted for in research. This is often accomplished with sensors for temperature, humidity, soil moisture, light quality, etc., that can be expensive and require more and properly trained personnel. Moreover, data collection is commonly subject to human error, especially when typing information and numbers into a spreadsheet. Fortunately, there are inexpensive computers such as a Raspberry Pi (Figure 1) that along with its sensors can make data collection inexpensive, easier, and more accurate.
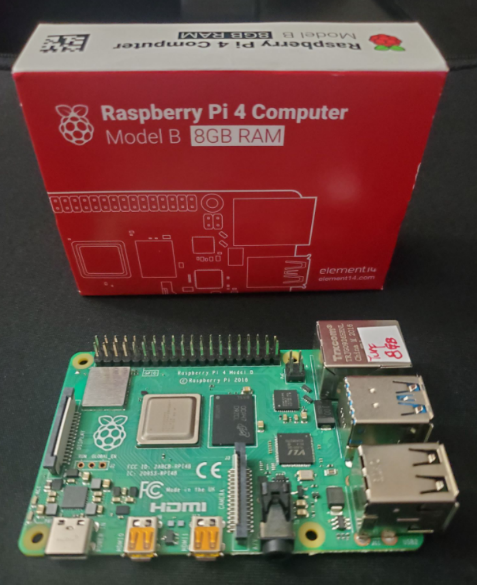
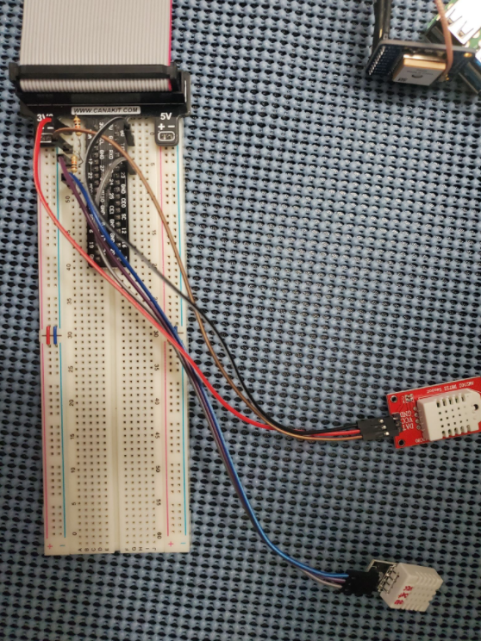
A Raspberry Pi is a great example of a small single-board computer that can facilitate data collection in plant sciences and strengthen your programming skills. While the Raspberry Pi project was originally intended to teach basic computer science concepts in high schools, the original model has become widely popular in different fields, including precision agriculture. Current Raspberry Pi models can be purchased online for approximately $35 - $100 USD; its sensors, which are attached to a general-purpose input/output (GPIO), can be as cheap as $1 USD (Figure 2). In this blog post, I will briefly describe a few examples of projects that I’m currently developing that could help your data collection.
Getting Started with a Raspberry Pi
There are multiple ways to get started and develop projects with a Raspberry Pi. However, I suggest following the official documentation and tutorials at Raspberry Pi Project. For any of these projects, it is necessary to have a Raspberry Pi, an SD card (at least 8GB) to install the operating system (OS), a monitor with an HDMI cable, keyboard and/or mouse, and internet connection. The easiest way to install the Raspberry Pi OS is by downloading the Raspberry Pi Imager on your own computer, then following the instructions. Once the Raspberry Pi is set up, you can continue to access it either with the peripheral devices, or “headless” through an SSH connection and then access it from your own device using VNC Viewer or similar software.
Once your Raspberry Pi is fully working and you are able to access it, you can start working on projects. Here I will briefly describe projects for time-lapses, automated data entry, and green cover for turf plots, but there are even more possibilities for other projects.
Project 1: Time Lapse Videos
Whether you want to monitor plant germination, development, maturity, or simply capture a beautiful sunset, time-lapses can be a fun and useful idea. In a previous blog post, I described my 2D imaging approach to look at spike architecture in perennial ryegrass as a way to understand seed shattering. A limitation of such a system is the fact that we can’t study the architecture in 3D, but a time lapse of flowering could help us overcome this issue, when the plants are grown in controlled conditions. On top of that, we could analyze the images in real-time using computer vision techniques with programs such as PlantCV. However, it is important to know that the image and data quality depends on the camera specifications and light conditions; it can be difficult to obtain high quality images with a cheap camera (Figure 3).
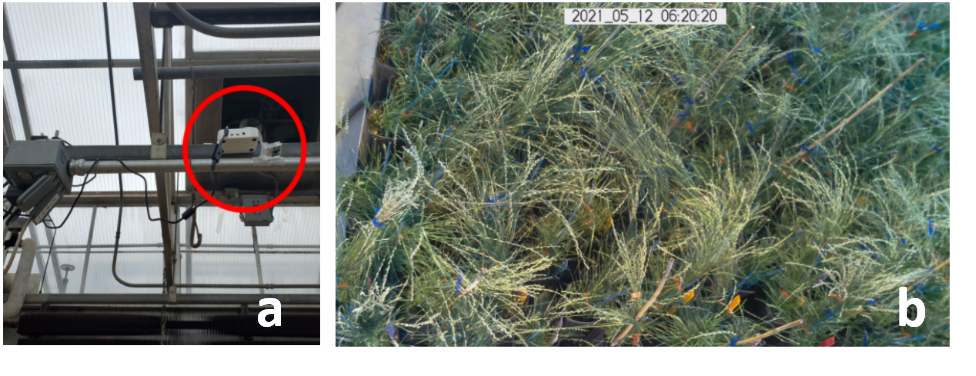
To test this idea, I attached the Raspberry Pi 4 Model B (Figure 1) with a $10 USD Raspberry Pi Camera Module V2 to the greenhouse structure (Figure 4a) and collected images (Figure 4b) throughout the day for more than 10 weeks. The quality of this camera is not the best for my research purposes but this can be easily improved with a better quality camera if desired.
Watch the full video of the time lapse.
We could also add sensors to the Raspberry Pi and collect images and climate data simultaneously. This would help us associate any abrupt changes in development or morphology with variation in climate conditions.
Project 2: Automated Data Collection
A main challenge during data collection is to avoid entering wrong sample IDs and/or numbers. This is a difficult problem when multiple people use the same spreadsheets to enter information for extended hours and days. After experiencing some of these issues, I started to develop a system to automate this type of data collection using a Raspberry Pi with a camera and a bit of programming. This system won’t require you to type numbers or sample IDs; instead it will take a picture and automatically enter the data into your spreadsheet!
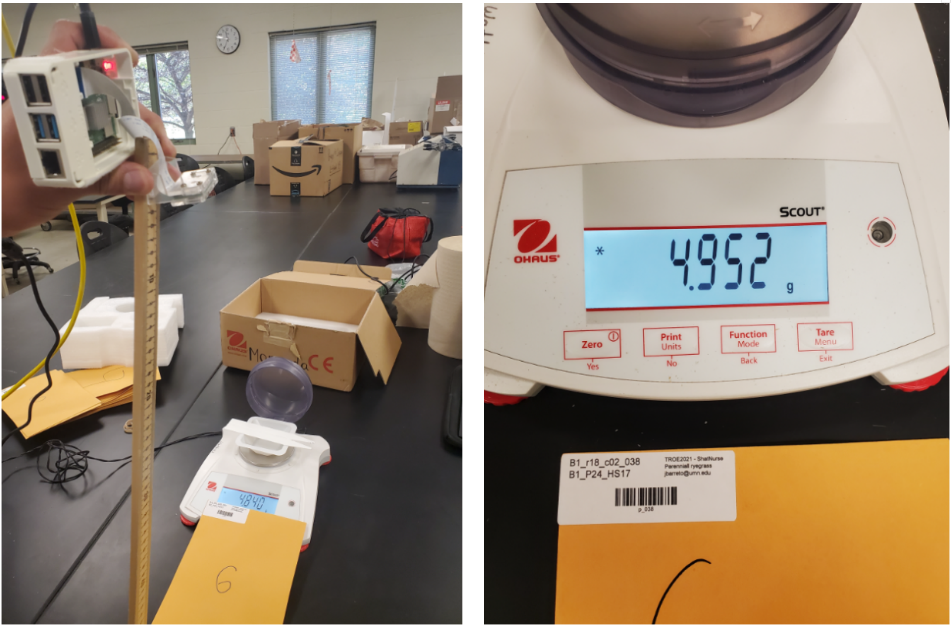
The idea is to attach the Raspberry Pi with a camera to a fixed platform with a scale and space for sample IDs. The Raspberry Pi needs to be at a proper height depending on the camera and light conditions, so that the images have high quality (Figure 5a and b). As long as the scale display and the samples are located in the same area of the image, the downstream image analysis is easy to accomplish. Nonetheless, this type of technology can also be adapted to variable images using machine learning techniques; for example, check out this blog post: Deep Learning based Text Detection Using OpenCV.
For this project, the most important components besides the Raspberry Pi and Python, are Tesseract and Pyzbar. Tesseract is an open-source engine that can recognize digital characters and Pyzbar is a Python library that can read barcodes and QR codes. Tesseract can also be used to read sample information if barcodes or QR codes are not available. Although there are scales that automatically enter the data on spreadsheets, these are more expensive, could require a third-party software, and can be difficult to customize. This Raspberry Pi project on the other hand, is inexpensive, open source, allows to link samples with other files, and can keep photographic records of what was weighed which helps to reduce errors in data collection and analysis.
This tutorial, Optical Character Recognition (OCR) using Tesseract on Raspberry Pi, offers plenty of information to replicate the system.
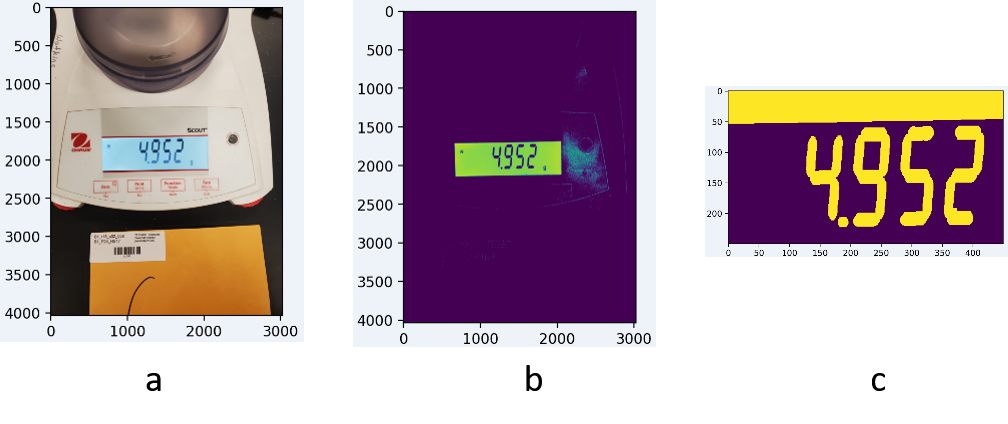
Figure 6 shows the general process of reading digital text from an image. After reading the image, it is important to either color-threshold the image or apply an edge detector to identify the display. This would be easier if the display and sample information are always in the same or similar position.
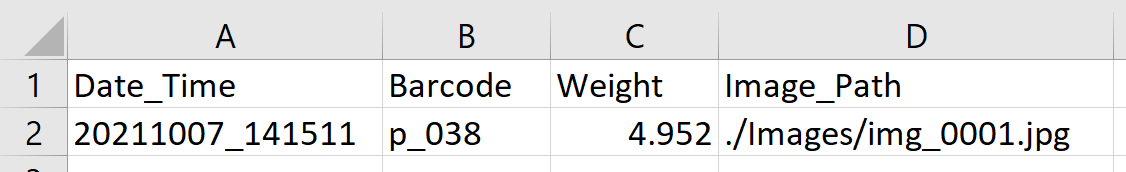
Once Tesseract detects the text, this can be stored as a string along with any other desired variables and saved to a recurrently used .txt, .csv, or even a sheet on an Excel file using simple Python code. For example, the date and time can be concatenated into a single variable that can be followed by the Sample ID or barcode, the sample’s weight, and the image path (Figure 7).
Project 3: Green cover and turf quality
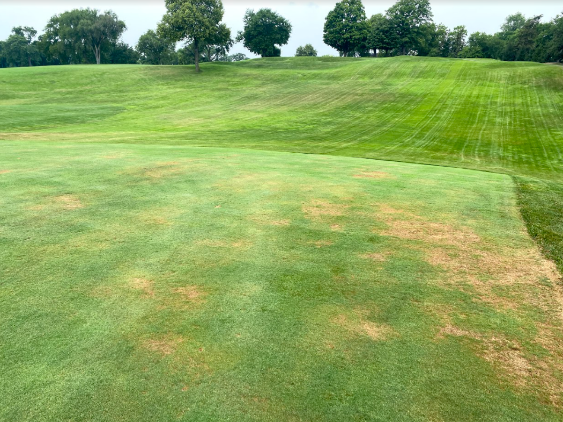
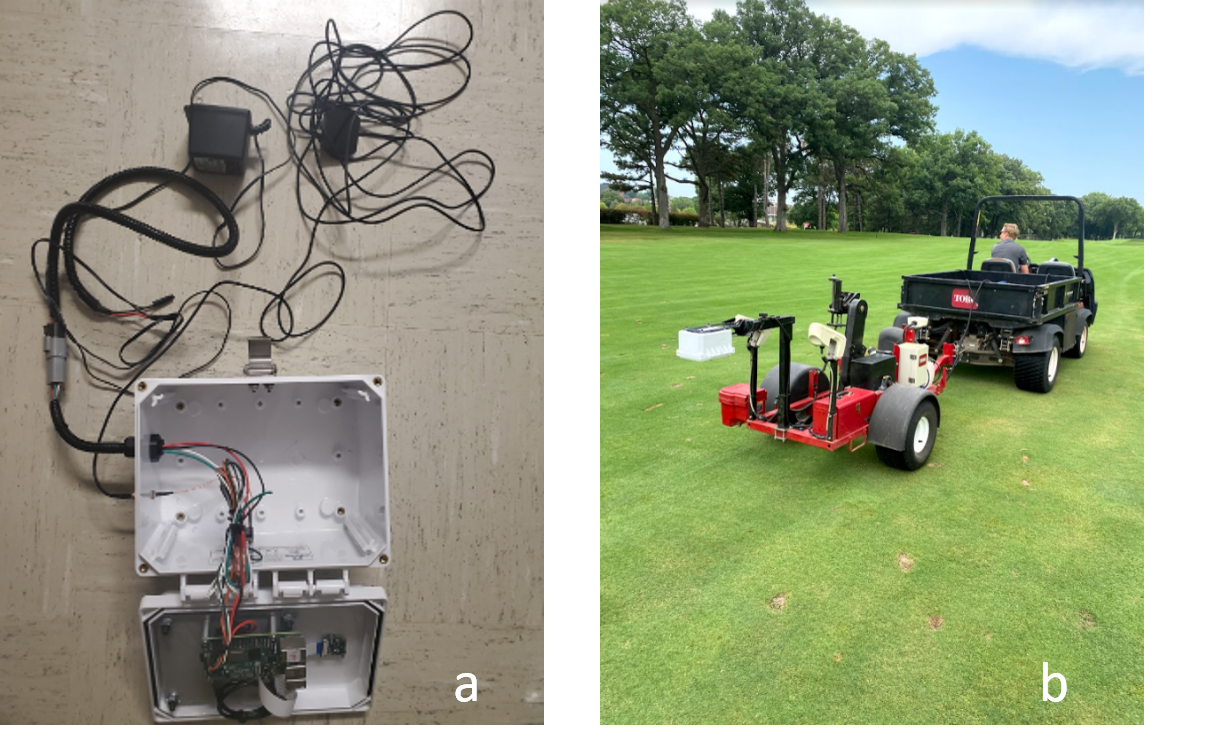
Estimating disease incidence, presence of weeds, and any other trait based on visual observation is highly subjective. This is often the case in turf research areas but also in athletic fields such as golf courses (Figure 8). Fortunately, we could also use imaging technology and design Raspberry Pi-based hardware to develop more accurate, precise and faster methods to evaluate turf quality.
We are currently developing an automated system that contains images with their respective GPS coordinates in a golf course. By mounting the Raspberry Pi on a cart (Figure 9) we can drive around the golf course collecting images of the greens and identify spatial patterns causing plant stress. This tool could help golf superintendents to define best timing and management practices based on accurate and precise data. Similarly, it can help researchers to quantify quality traits and therefore develop better strategies for either cultivar development or agronomic strategies.
Raspberry Pi and similar devices can be quite useful in plant research. There is abundant documentation on how to get started, how to develop projects, and how to troubleshoot most issues. These types of technologies are rapidly evolving and replacing older and subjective data collection methods. Therefore, learning about them is important to continue developing effective plant research.
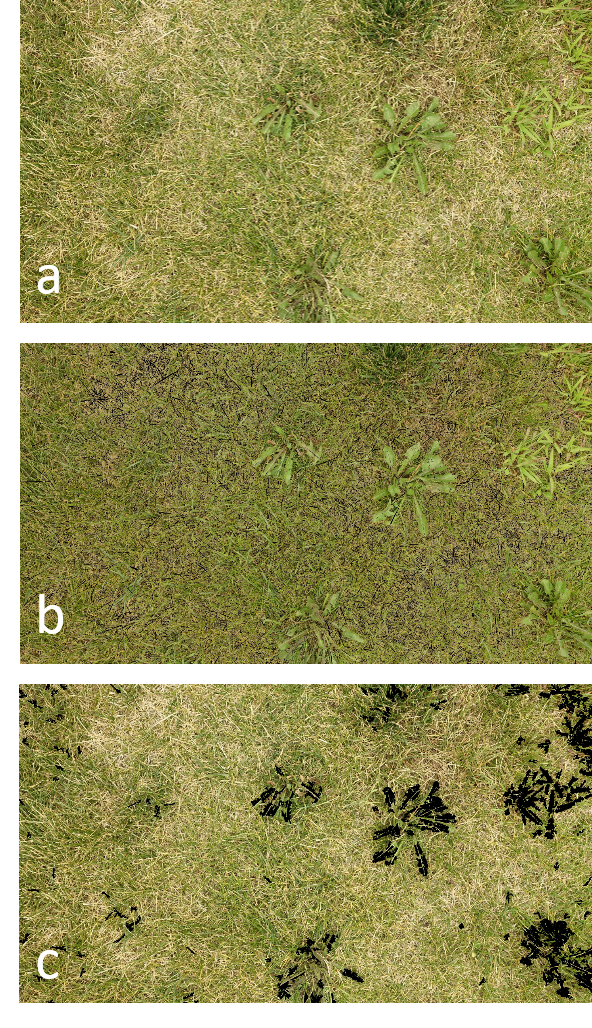
Figure 10 shows another example of how such a system could help to quantify weed abundance and stress in greens.
Raspberry Pi and similar devices can be quite useful in plant research. There is abundant documentation on how to get started, how to develop projects and how to troubleshoot most issues. These types of technologies are rapidly evolving and replacing older and subjective data collection methods. Therefore, learning about them is important to continue developing effective plant research.