By Parker Anderson, Research Scientist
Science of the Green Initiative
The Turfgrass Science Research Lab’s Science of the Green Initiative, a research partnership between the University of Minnesota and the United States Golf Association, just completed its pilot of a nation-wide study on the impact of course conditions on pace of play. This portion of the study focuses on the variable of green speed. Green speeds not only impact player experience but also the maintenance practices of course superintendents. The pilot study was conducted at the Philadelphia Cricket Club Militia Hill Course just outside of Philadelphia, PA. A University of Minnesota Turfgrass Researcher worked with the host superintendent to adjust the speed of the greens (Image 1) in three consecutive weeks while maintaining the rest of the course consistent with the standards of their facility. Golfers participating in the study were given GPS loggers (Image 2) to carry in their pocket. The GPS loggers captured time and location of each golfer during their round. The GPS loggers were then collected at the end of the round and the data analyzed. The result for each golfer is a “track” of their path throughout their round (Image 3). Researchers can now analyze these tracks and compare the tracks from week to week focusing on the player’s interaction with the green. Future study sites for this project will be in Minnesota, Northern California, the Carolinas, and Philadelphia.
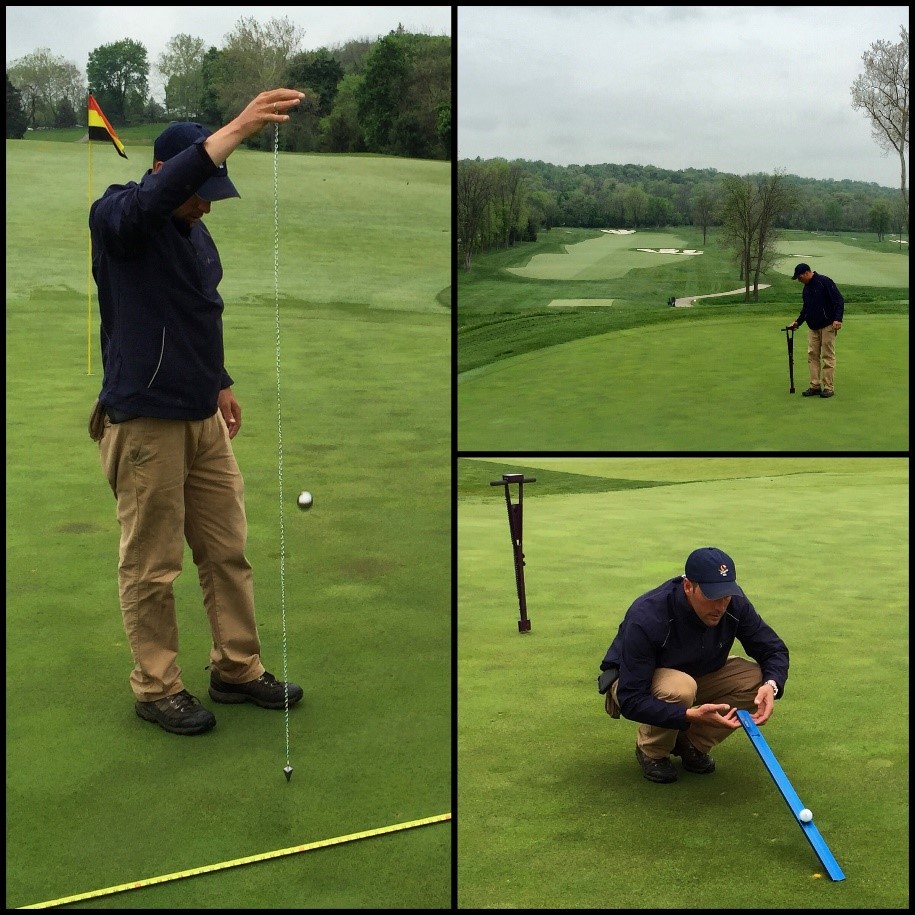
Image 1: Militia Hill Course Superintendent Curtis Harder checks green firmness, green moisture content, and green speed. (Photo: Parker Anderson)
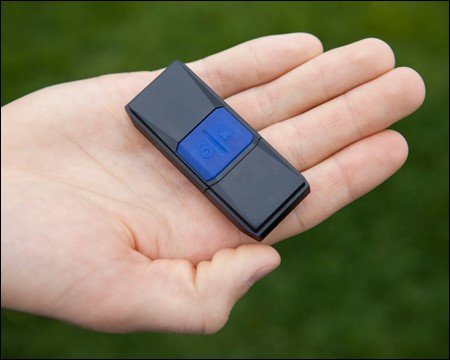
Image 2: GPS logger, about the size of a flash drive, used to capture data during a round of golf. A golfer will receive a GPS logger on the first tee, keep it in their pocket for the round, and turn it in after their round. (Photo courtesy of the United States Golf Association)
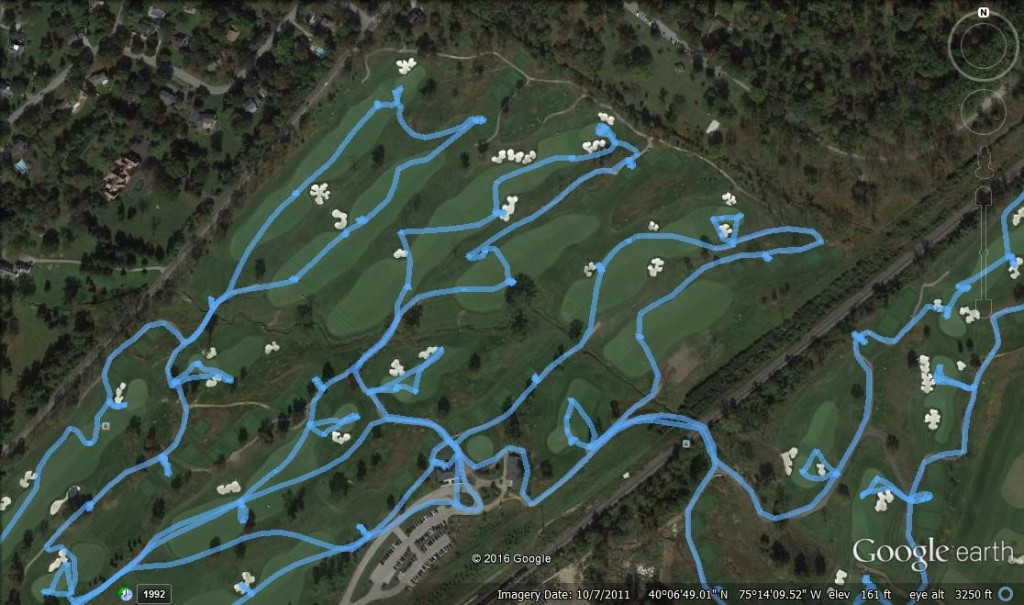
Image 3: A visual representation of the data, or an individual golfer’s “track”, resulting from using a GPS logger for a round of golf. (Image courtesy of Google Earth)