By: Jonah Reyes, Research Scientist

Image 1: 12” Drip line above MNST-12 sod and seed. (Photo: Jonah Reyes)
The University of Minnesota has been working with the Minnesota Department of Transportation on improving the success of salt-tolerant turfgrass mixtures established as seed and sod. Salt tolerant mixtures are composed primarily of fine fescues and the current specified mixture is MNST-12. A major factor that has been attributed to limited success of this mixture is the insufficient application of water during the establishment period. To study this, three irrigation methods were evaluated in 2016; 12” and 18” emitter spacing drip irrigation systems and a fixed spray system using Hunter MP Rotator nozzles. We designed a six-treatment trial using these three irrigation methods and replicated each treatment three times. The systems were installed on plots seeded or sodded with the MNST-12 mixture at two boulevard sites with a water hydrant and one sloped site located at the Turfgrass Research Center in St. Paul. The following is a list of these treatments:
- 12” x 12” drip tape style irrigation placed BELOW sod or to a ½” depth in soil for seed
- 12” x 12” drip tape style irrigation placed ABOVE sod or at the soil surface for seed
- 18” x 18” drip tape style irrigation placed BELOW sod or to a ½” depth in soil for seed
- 18” x 18” drip tape style irrigation placed ABOVE sod or at the soil surface for seed
- Overhead irrigation with MP Rotator
- Un-irrigated control
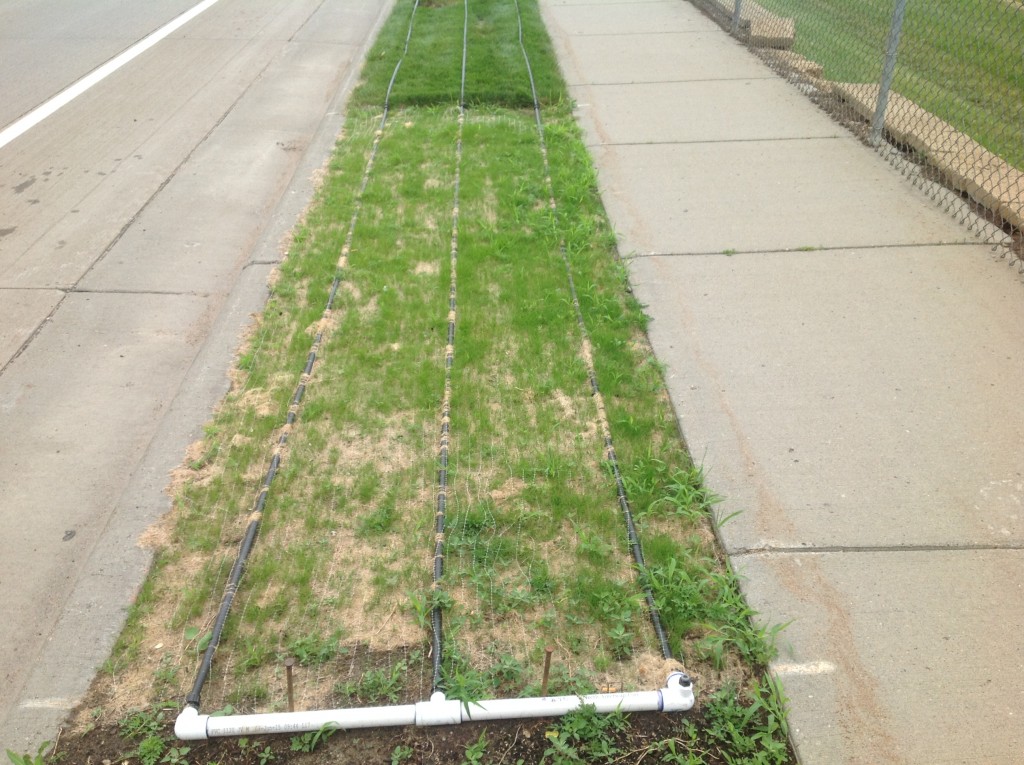
Image 2: 18” Drip line above MNST-12 seed and sod. (Photo: Jonah Reyes)
After the 60-day establishment period, the above sod drip irrigation treatments maintained acceptable quality of MNST-12 sod. The highest ratings for green tissue and quality were achieved with the 12”x12” drip irrigation design placed above sod (Image 1), followed by 18”x18” above sod systems (Image 2). Below sod drip systems provided intermediate quality, while the overhead irrigation design received the lowest quality ratings of the irrigated treatments. The poor performance of the below sod treatments was attributed to a lack of turf quality and rooting of sod above the drip line. The poor performance of the fixed spray irrigation systems was attributed to the reduction in water distribution near the outside edges of the plots. The unirrigated control treatments did not produce acceptable establishment and the sod appeared to be dead approximately 5-6 days after planting (Image 3).
Throughout the trial period, irrigation volumes were programmed based on observed soil moisture requirements. Prior to planting sod, the soil was pre-wet to minimize the initial shock from sod placed on dry soil. On the day of planting, 0.15” of irrigation was applied in two separate cycles. For the 10-day period following planting, both seed and sod treatments were irrigated with 0.15” of water 2x per day for a daily total of 0.30” and a weekly total of 2.1”.
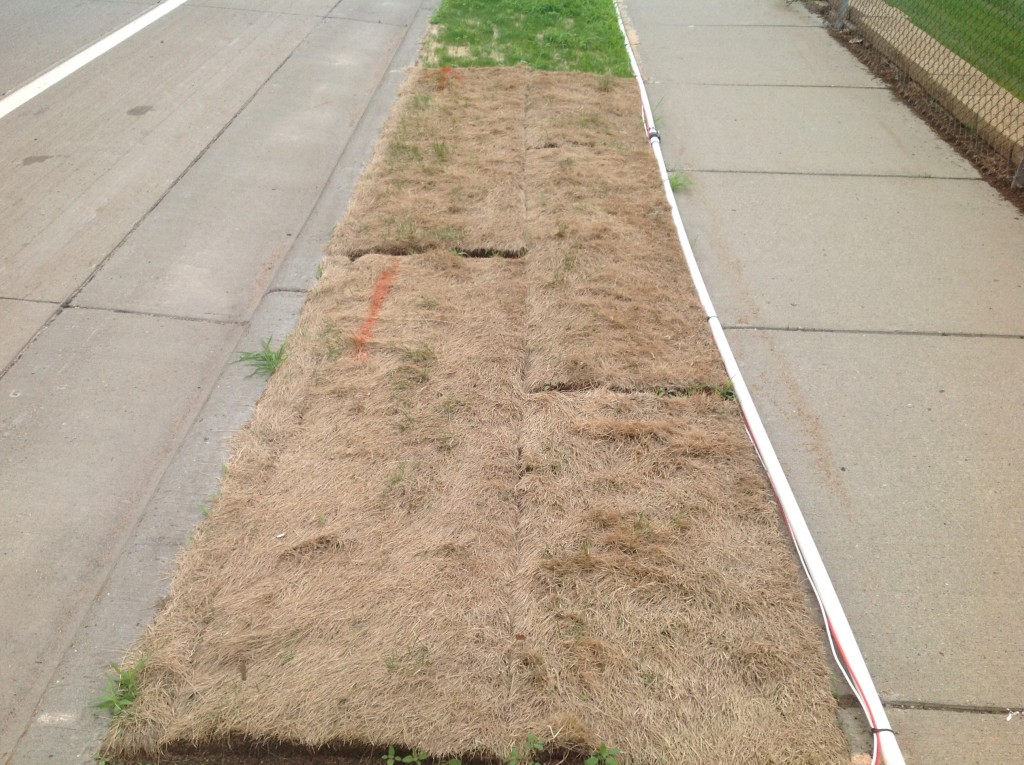
Image 3: Control treatment MNST-12 sod. (Photo: Jonah Reyes)
Days 11-30, seed and sod were irrigated with 0.15” per day (1.05” weekly), and days 31-60 irrigation was applied every other day at 0.15” (0.45” to 0.60” weekly). Over the 60-day trial period, 14,212 gallons or an equivalent of 11″ of water was applied to the trial area, costing $62.80.
Volumetric Water Content (VWC) using a TDR 300 Soil Moisture Meter including GPS and visual ratings were recorded weekly. After the 60 day establishment period, turfgrass species and weed counts were recorded. Future ratings and evaluation of the 2016 sites will be recorded as well as the installation on two more sites next year.
| May 27 | June 2 | June 10 | June 17 | June 24 | July 1 | July 7 | July 14 | |
| Treatment | % Green | % Green | Quality | Quality | Quality | Quality | Quality | Quality |
| 12 x 12 A | 91.7 | 95.0 | 7.7 | 7.3 | 7.3 | 7 | 7 | 7 |
| 12 x 12 B | 63.3 | 65.0 | 5 | 5.3 | 5 | 5 | 5 | 5 |
| 18 x 18 A | 83.3 | 86.7 | 7 | 7 | 6.7 | 6 | 6 | 6 |
| 18 x 18 B | 80.0 | 81.7 | 6 | 6.3 | 6.3 | 5.7 | 5.7 | 6 |
| Overhead | 68.3 | 76.7 | 5.7 | 5.7 | 5.3 | 5 | 5 | 5 |
| Control | 1.7 | 0.7 | 1 | 1 | 1 | 1 | 1 | 1 |
Figure 1. Percent green tissue and turfgrass quality ratings for MNST-12 sod planted on May 19th, 2016 on Larpentuer Ave. in St. Paul. Quality ratings are on a 1-9 scale where 1= worst and 9 = best. A rating of 6 is considered acceptable.