By Eric Watkins
Each year, the turfgrass research team at the University of Minnesota evaluates thousands of plots for turf performance. The summarized results from 2018 are now posted on our cultivar evaluation results page. Checking results from local turfgrass evaluations is an important part of purchasing turfgrass seed. I have briefly summarized some background information below on the rating and interpretation process to help you better understand these results.
How are these plots rated?
Typically, these evaluations are done visually, with a turfgrass researcher giving a score to each plot. The primary rating is “turfgrass quality”, which is rated on a scale of 1-9, with a 9 representing the best turfgrass quality and a 1 representing the poorest turfgrass quality (if you are wondering why we use this scale, it was so in the beginning, is now, and ever shall be, amen). Turfgrass quality is a combination of traits that make a turf aesthetically pleasing, including color, density, freedom from disease and weeds, and uniformity.
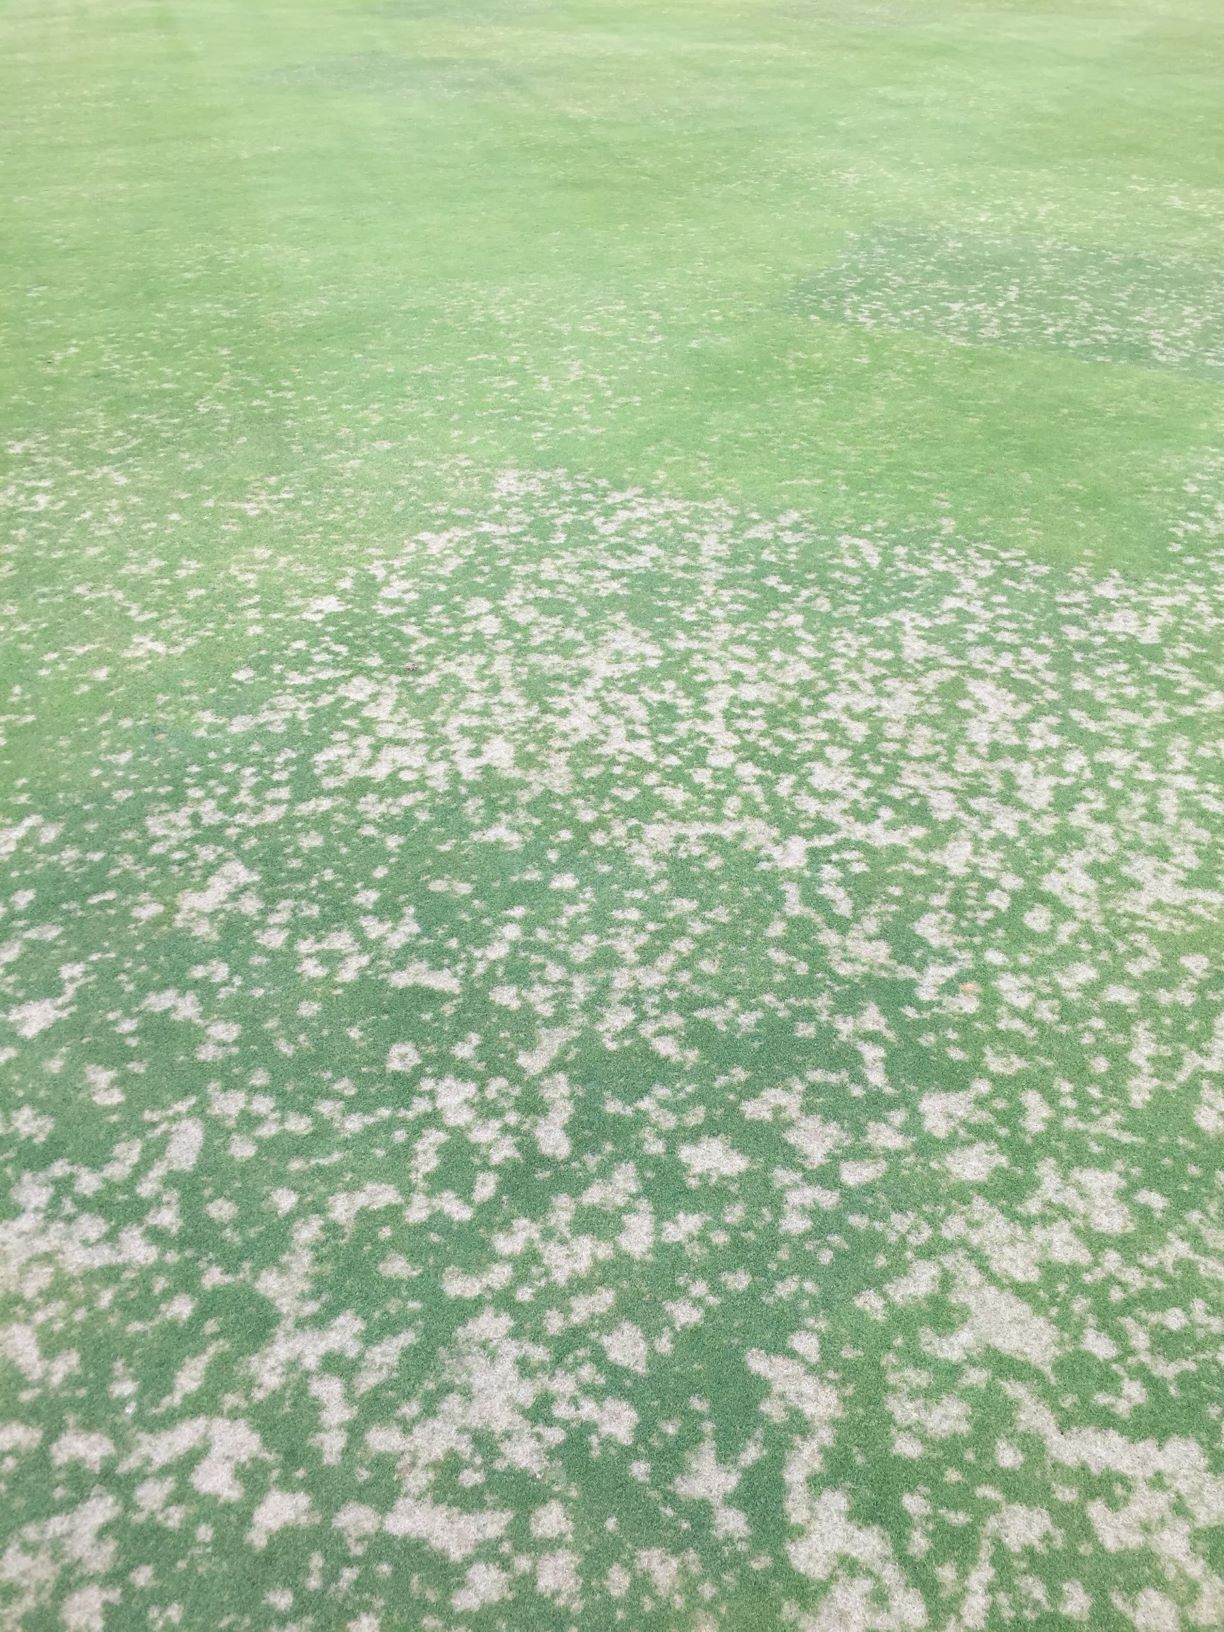
Many trials are also rated for turfgrass cover (how much grass is there, compared to weeds or bare soil), color (how dark or green turf is). Other ratings are taken as stresses are observed. For instance, whenever a disease becomes severe enough that cultivar differences begin to show up, a disease rating is taken. Disease progression is then monitored and if it becomes severe enough, a fungicide application is made (a table with all applications of fertilizers and pesticides, along with other management information is also included in our 2018 results). Sometimes progression is not monitored well enough (Figure 1).
What is NAI-13-9?
In all trials, there are both experimental and commercially-available entries. The experimental entries are newer entries that turfgrass breeders want tested and are usually coded with some combination of letters and numbers, while the commercially-available entries are almost always given a name. There are some exceptions; for instance, Seed Research of Oregon has historically named cultivars with an SR- followed by numbers. If you aren’t sure if something is commercially available, a quick Google search should help you figure it out.
How do I interpret the results?
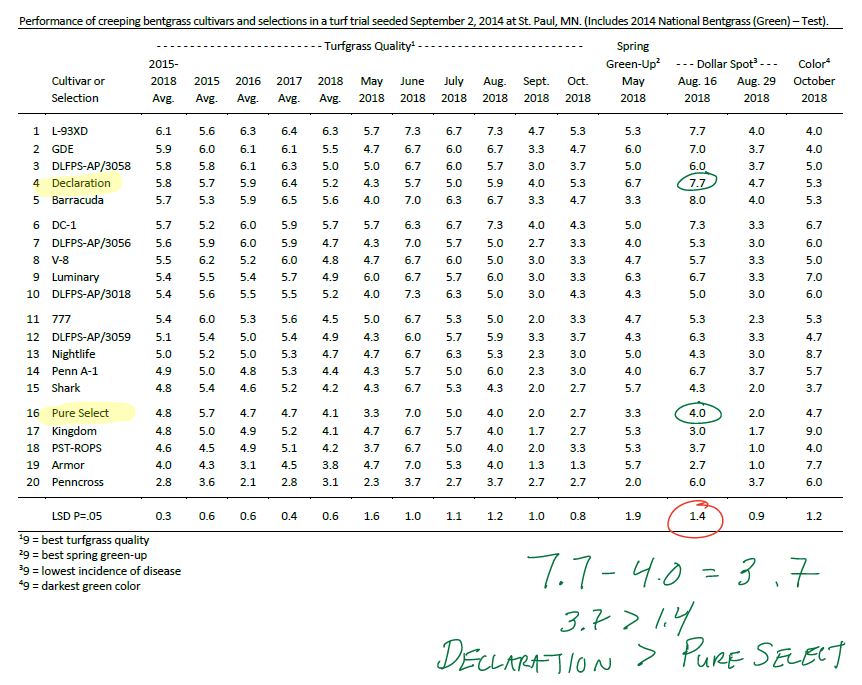
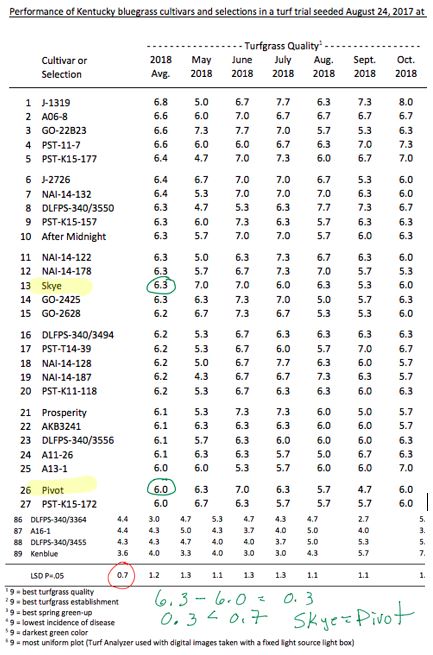
Each of our trials consists of three replications so each entry (cultivar or experimental) is planted into 3 plots in each trial (you can imagine a large rectangular field split into three blocks of equal size, with each entry being present in each block). This is important because the fields in which these trials are planted can be quite variable; for instance, a small area of the field might have a tendency to collect more water, or maybe the soil in a small corner of the trial has an abnormally high amount of phosphorus. Planting three replications reduces the chance that will get a result that isn’t representative of reality. The results from these three plots are then averaged, and this value (the mean for the entry) is reported. At the bottom of each data column in the table, we report a “Least Significant Difference” (LSD) value; this number can be used to determine if two means are different than one another. The LSD is calculated based on an analysis of the variance in the trial--if there is a lot of variability in the trial, the LSD value will be higher, and if entries perform consistently in all three replications, then the LSD value will be lower.
In Figure 2, you can see that “Declaration” creeping bentgrass was scored as a 7.7 for dollar spot disease incidence on August 16 while “Pure Select” received an average score of 4.0, which is a difference of 3.7 points on the rating scale. The LSD value for that rating was 1.4, so that means that these two cultivars were statistically different for dollar spot resistance (Declaration was better than Pure Select). The value is typically calculated at the 0.05 level, which means there is a 95% chance that these two cultivars have different responses to dollar spot pressure. A golf course superintendent picking between these two cultivars for a reseeding project where dollar spot resistance was really important might consider going with Declaration.
Where else can I find data?
If the data you need when selecting a turfgrass isn’t available in our results, another place to look is the National Turfgrass Evaluation Program (NTEP). The data on the NTEP website can be a little difficult to find, but the results are reported similarly to ours. We are part of a larger project aiming to make these types of data more accessible to the public, so we hope in the next few years there will be easier and more effective ways to obtain turfgrass cultivar performance data across multiple turf species adapted for our region.
Ntep looks familiar--where have I seen that before?
Nan Ntep is the French inspector played by Eye Haidara in the second season of Patriot on Amazon Prime.
I hope this information will be helpful when you next find yourself faced with trying to find a suitable turfgrass. For more information about seeding a lawn, please visit the UMN Extension lawn care page.


